Charts: November 2021’s Private Residential Spending Up
Originally Published by: Eye on Housing — January 3, 2022
SBCA appreciates your input; please email us if you have any comments or corrections to this article.
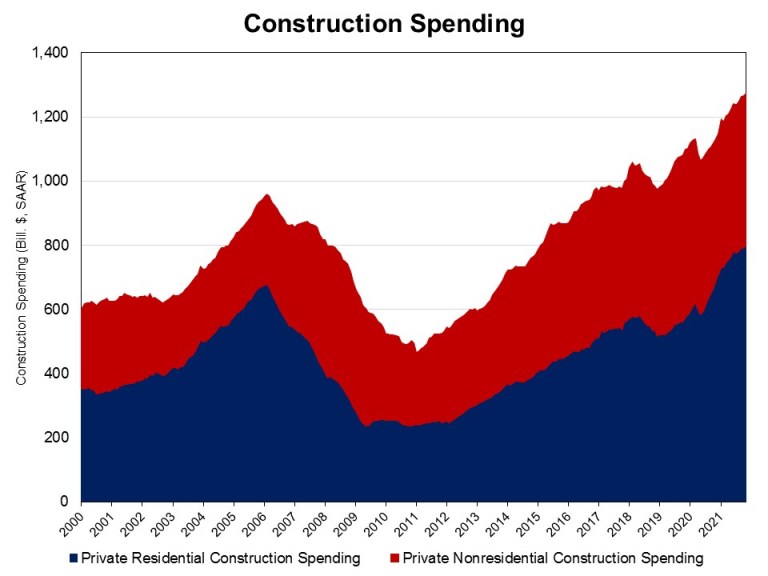
NAHB analysis of Census Construction Spending data shows that total private residential construction spending rose 0.9% in November after a decrease of 0.2% in October 2021. It stood at a seasonally adjusted annual rate of $796.3 billion. Total private residential construction spending was 16.3% higher than a year ago.
These monthly gains are attributed to the strong growth of spending on single-family and improvements, while spending on multifamily constructions slipped. Single-family construction spending increased to a $421 billion annual pace in November, up by 1.2% over the upwardly revised October estimates. Spending on improvements rose 0.9% in November, after staying unchanged in October. Multifamily construction spending dipped 0.3% in November. However, it was 9.6% higher than a year ago. Home building is still facing supply chain issues, which means the industry is dealing with rising material costs as well as ongoing labor shortages.
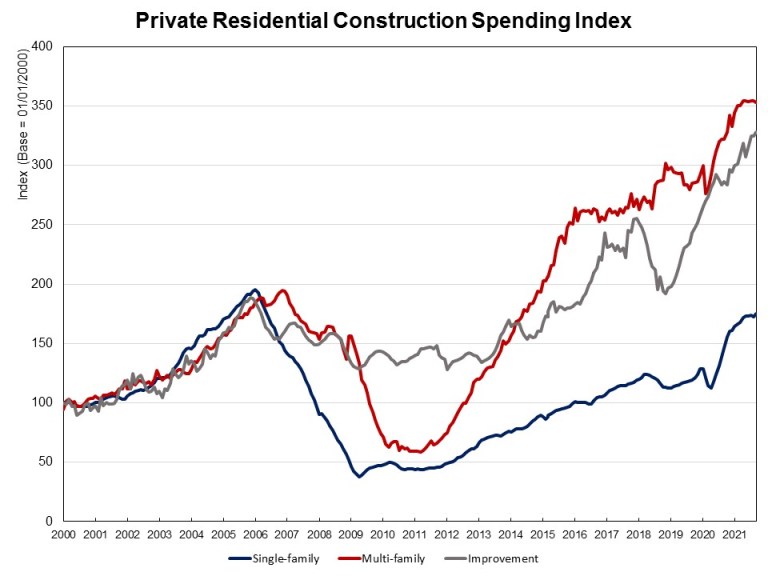
The NAHB construction spending index, which is shown in the graph below (the base is January 2000), illustrates the solid growth in single-family construction and home improvement from the second half of 2019 to February 2020, before the COVID-19 hit the U.S. economy, and the quick rebound since July 2020. New multifamily construction spending has picked up the pace after a slowdown in the second half of 2019. Under the pressure of supply chain issues, construction spending on single-family, multifamily and improvements slipped down a bit from the third quarter of 2021.

div class="main-image">
