Insights into Multi-Family Construction Trends
Originally Published by: NAHB — July 8, 2024
SBCA appreciates your input; please email us if you have any comments or corrections to this article.
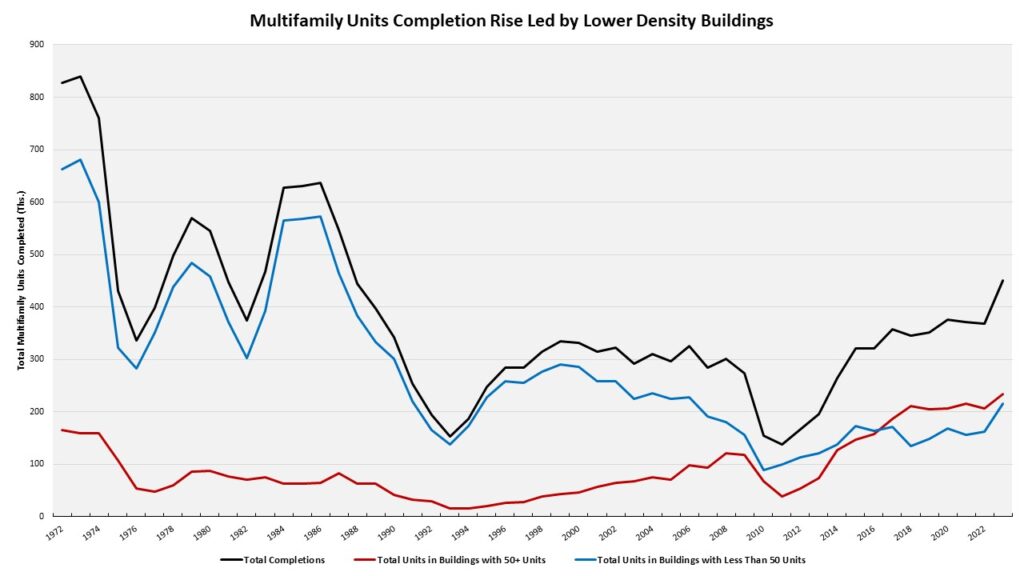
Reaching the highest level of multifamily completions since 1987, 450,000 multifamily units were completed in 2023, with 216,000 units completed in buildings with fewer than 50 units according to NAHB Analysis of the Census Bureau’s Characteristics of Units in New Multifamily Buildings Completed. This was the highest number of units in such buildings since 2006.
A majority of multifamily units continued to be built in buildings with 50 or more units (these will be labeled as high-density buildings), marking the seventh straight year that this has occurred. As shown below, this trend is relatively new; dating back to the earliest data in the series (1973), most multifamily units are historically located in buildings with less than 50 units (low-medium density buildings). The 450,000 units completed in 2023 is the highest level of multifamily completions since 1987, when there were 546,000 multifamily units completed.
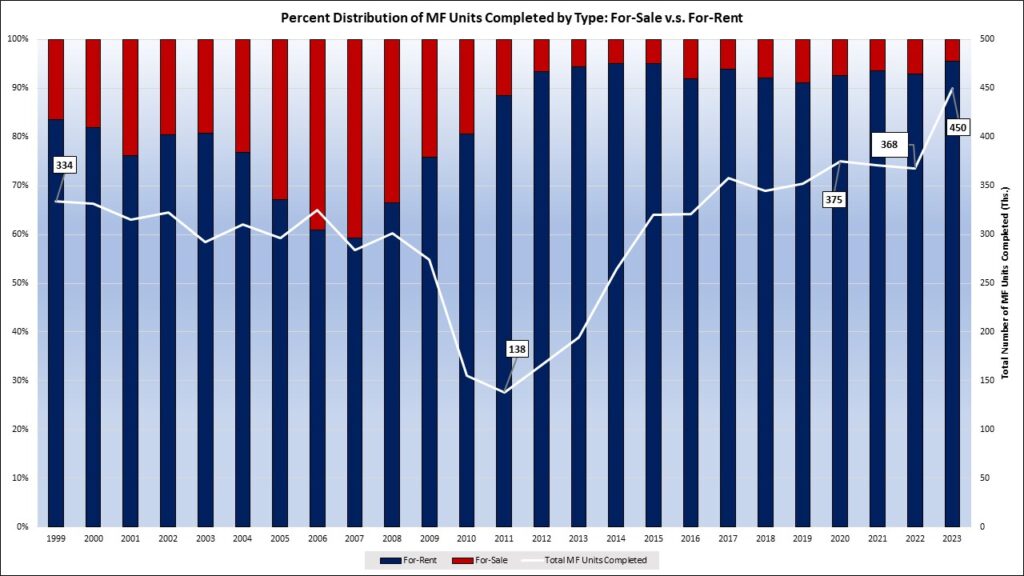
The built-for-rent share increased to a new high at 96% in 2023, with the remaining 4% of units being built-for-sale. Looking at the levels, 430,000 multifamily units were built-for-rent, up from 342,000 in 2022, a 25.7% increase over the year. Multifamily units built-for-sale fell to 20,000 units, down 23.1% from the previous year of 26,000 units.
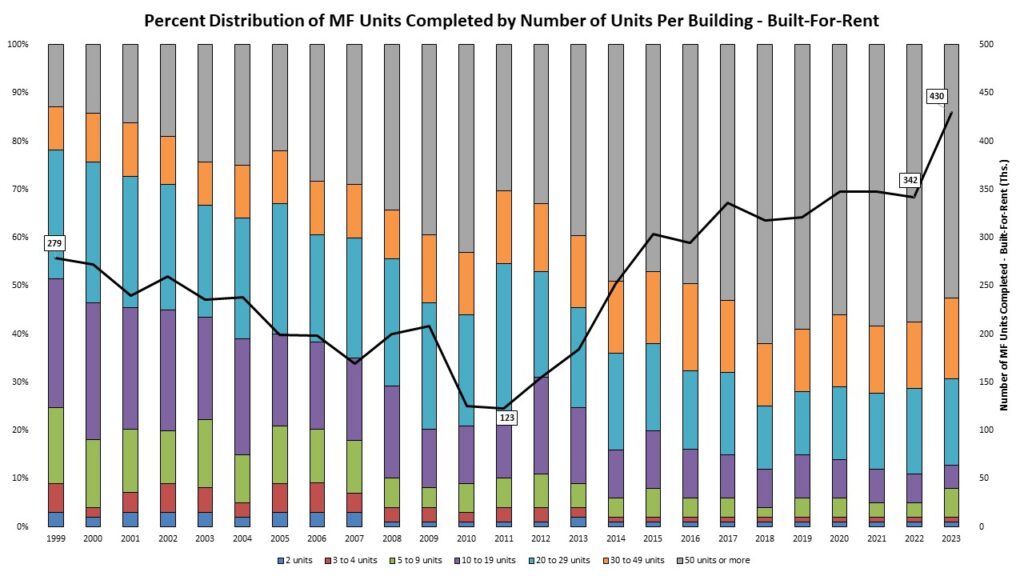
Built-for-Rent
Among multifamily units built-for-rent, 53% were completed in high-density buildings. This share is the lowest for built-for-rent units since 2017, which was also 53%. The share is down from 58% in 2022 and 59% in 2021. The largest increase in the share of multifamily units, both up 3%, was for buildings with 5 to 9 units (6%) and 30 to 49 units (17%). In terms of the number of units completed, buildings with 5 to 9 units stood at 24,000 units, growing a dramatic 167% from 2022. Buildings with 30 to 49 units completions stood at 71,000, up 44.9% from 49,000 in 2022.
Built-for-Sale
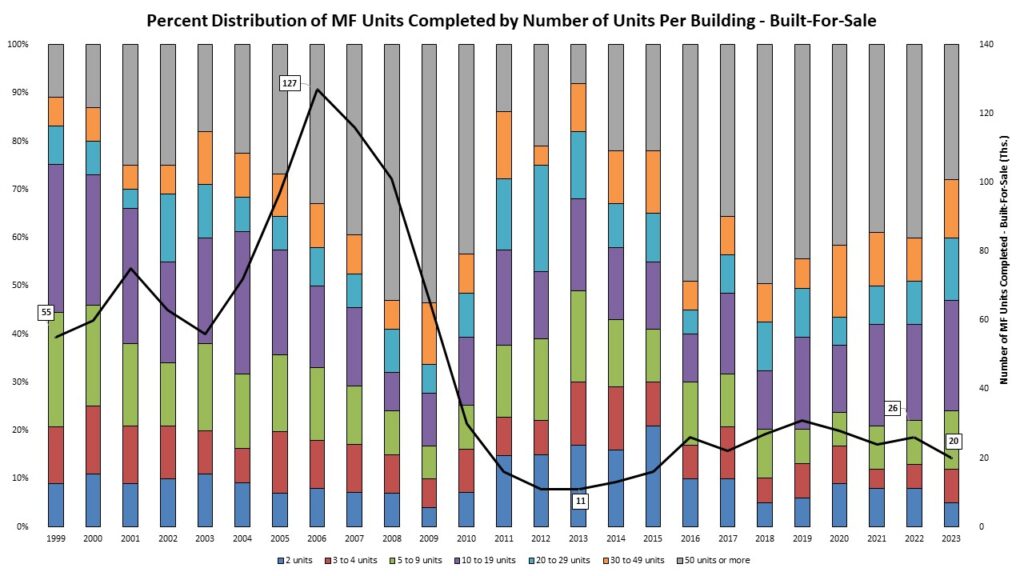
The number of multifamily units built-for-sale fell from 26,000 to 20,000. High-density buildings continued to be the primary type of building where these units were built, with 28% of built-for-sale units being completed in buildings with 50+ units. This share was down from 40% in 2022, a 12 percentage points decrease, the largest of any building type. The only other type of building to lose market share of built-for-sale units was the 2-unit building type, down from 8% to 5% in 2023. All other building types gained shares of units built, ranging from 2-4%, divvied up in the chart below.
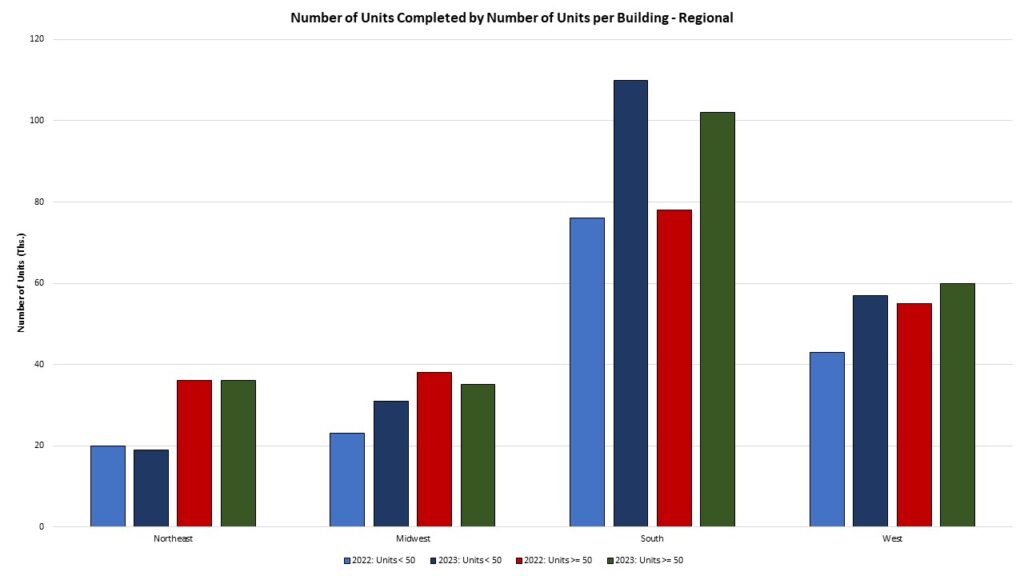
Regions
The largest home building region (South) saw more multifamily units completed in buildings with less than 50 units, a possible sign of changing consumer preferences. Renters/buyers of multifamily units could be searching for lower-to-medium density options opposed to high-density living. In the South census region, there were 110,000 multifamily units completed in low-medium density buildings, while units completed in high-density buildings stood at 102,000. Only the Northeast region had lower multifamily completions in 2023 compared to 2022, all others saw increases between the two years. For levels in 2022 and 2023, split by density, refer to the graph below.