Chart: August Single-Family Permits Up 25% YOY
Originally Published by: NAHB — October 15, 2021
SBCA appreciates your input; please email us if you have any comments or corrections to this article.
Over the first eight months of 2021, the total number of single-family permits issued year-to-date (YTD) nationwide reached 775,772. On a year-over-year (YoY) basis, this is a 25.8% increase over the August 2020 level of 616,856.

Year-to-date ending in August, single-family permits increased in all four regions. The Northeast region reported the strongest increase of 29.3%, followed by the South (+26.4%), the West (+25.7%), and the Midwest (+21.6%). Multifamily permits were robust across the country in August compared to last year; the West (+33.7%), Northeast (+27.2%), the Midwest (+24.9%), and the South (+24.6%).
Between August 2020 YTD and August 2021 YTD, all 50 states and the District of Columbia saw growth in single-family permits issued. The District of Columbia recorded the highest growth rate during this time at 208.0% from 87 to 268. The 10 states issuing the highest number of single-family permits combined accounted for 62.3% of the total single-family permits issued.

Year-to-date, ending in August 2021, the total number of multifamily permits issued nationwide reached 392,067. This is 27.5% ahead over the August 2020 level of 307,614.
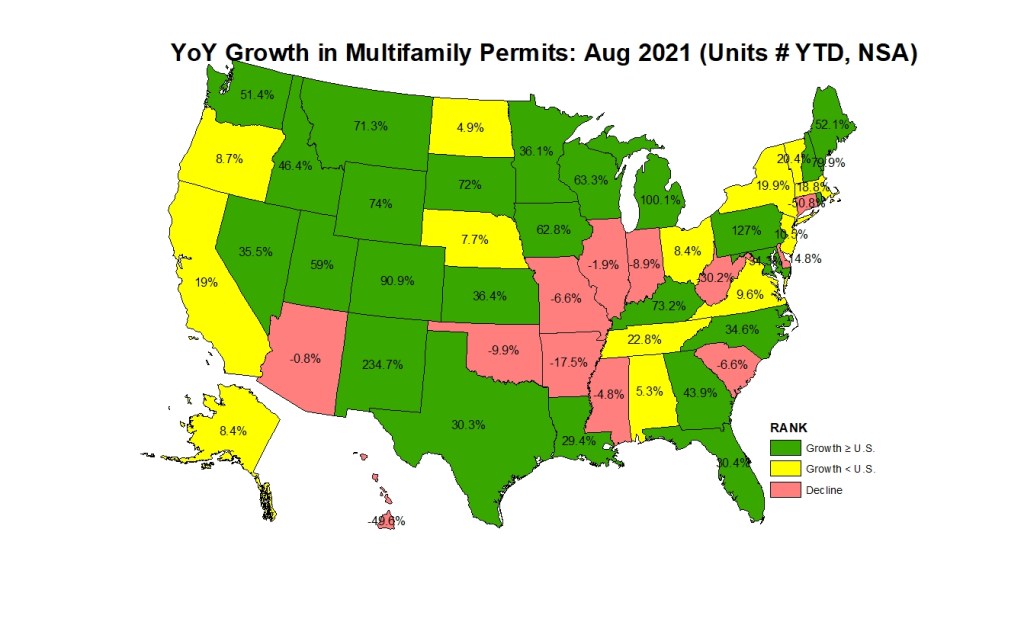
Between August 2020 YTD and August 2021 YTD, 38 states recorded growth while 12 states and the District of Columbia recorded a decline in multifamily permits. New Mexico led the way with a sharp rise (234.7%) in multifamily permits from 539 to 1,804, while Connecticut had the largest decline of 50.7% from 2,077 to 1,023. The 10 states issuing the highest number of multifamily permits combined accounted for 63.9% of the multifamily permits issued.

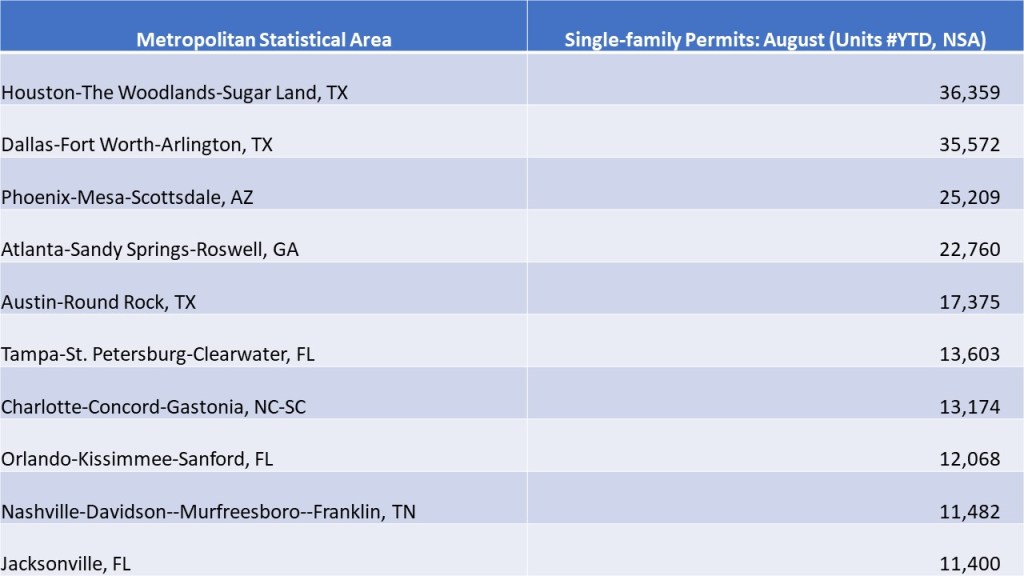
At the local level, below are top 10 metro areas that issued the highest number of single-family permits.

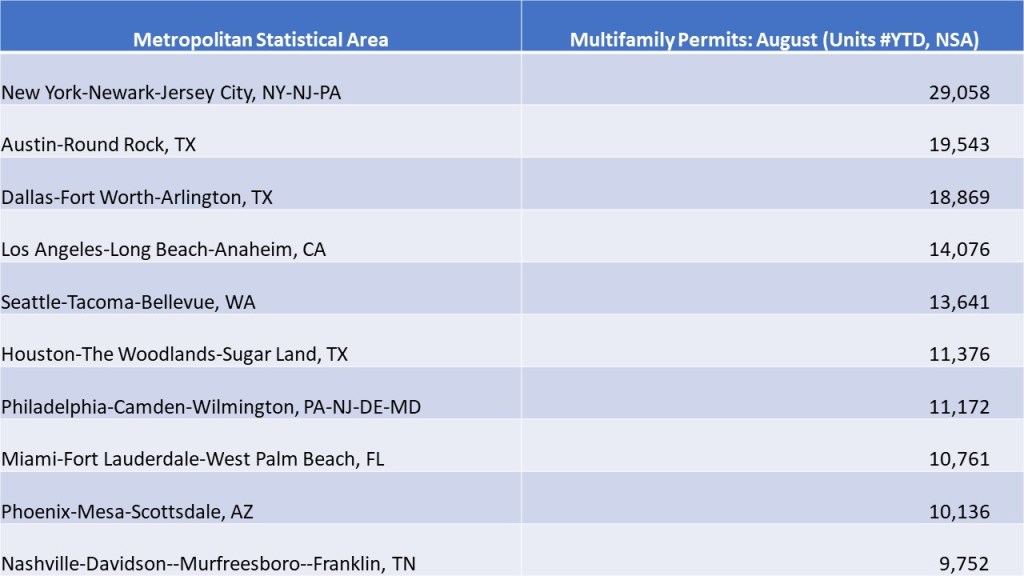
For multifamily permits, below are the top 10 local areas that issued the highest number of permits:

