Chart: Lumber Market Volatility Index Hits Record High
Originally Published by: NAHB — July 18, 2022
SBCA appreciates your input; please email us if you have any comments or corrections to this article.
The prices of goods used in residential construction climbed 1.5% in June (not seasonally adjusted) even as softwood lumber prices fell 23%, according to the latest Producer Price Index (PPI) report. Prices have surged 41.7% since January 2020. Building materials (i.e., goods inputs to residential construction, less energy) prices have increased 4.8%, year-to-date, and are 12.2% higher than they were in June 2021.
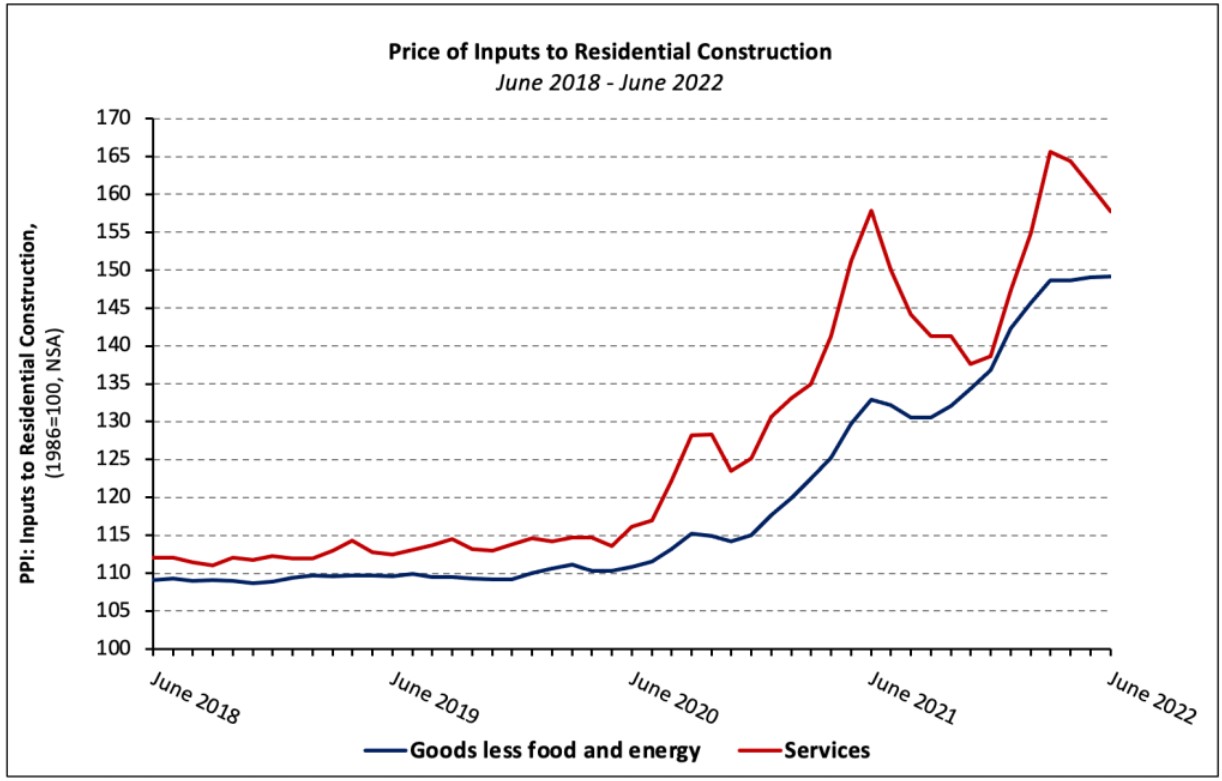
The price index of services inputs to residential construction was driven 2.1% lower in June after a 2.0% decline in May (revised) by decreases in the building materials retail and wholesale trade indices. The services PPI is 0.1% lower than it was 12 months prior and 37.6% higher than its pre-pandemic level.
Softwood Lumber
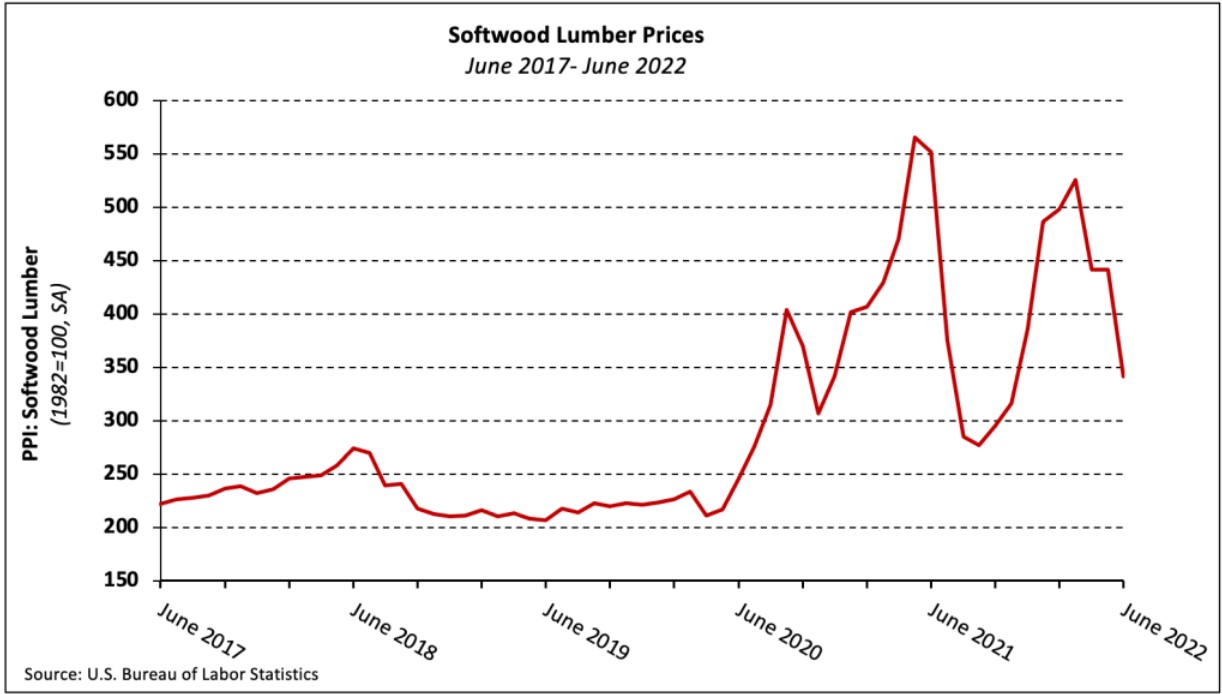
The PPI for softwood lumber (seasonally adjusted) fell sharply (-22.6%) in June, its second such decline in three months. Prices have fallen 35.0% since March 2022, although the extent to which the decrease has reached home builders and remodelers is unclear.
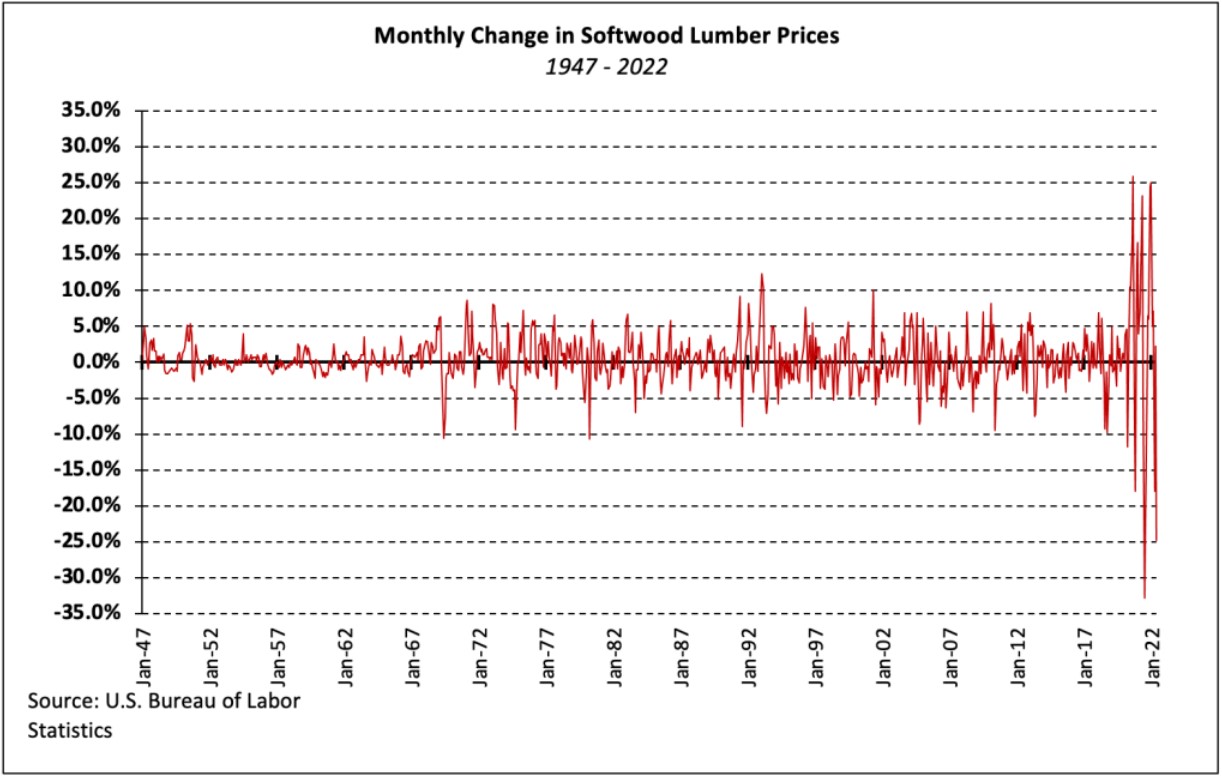
Since early 2020, softwood lumber prices have been extraordinarily volatile. The average monthly change in the PPI for softwood lumber has been 2.6% since January 2020, nearly nine times the average change (+0.3%) from 1947 to 2020. The volatility of softwood lumber prices has exhibited the same pattern relative to the “all commodities” PPI. While lumber prices were 19.7% more volatile over the 1947-2020 period, they have been 100.1% more volatile than the broader index since January 2020.
Ready-Mix Concrete
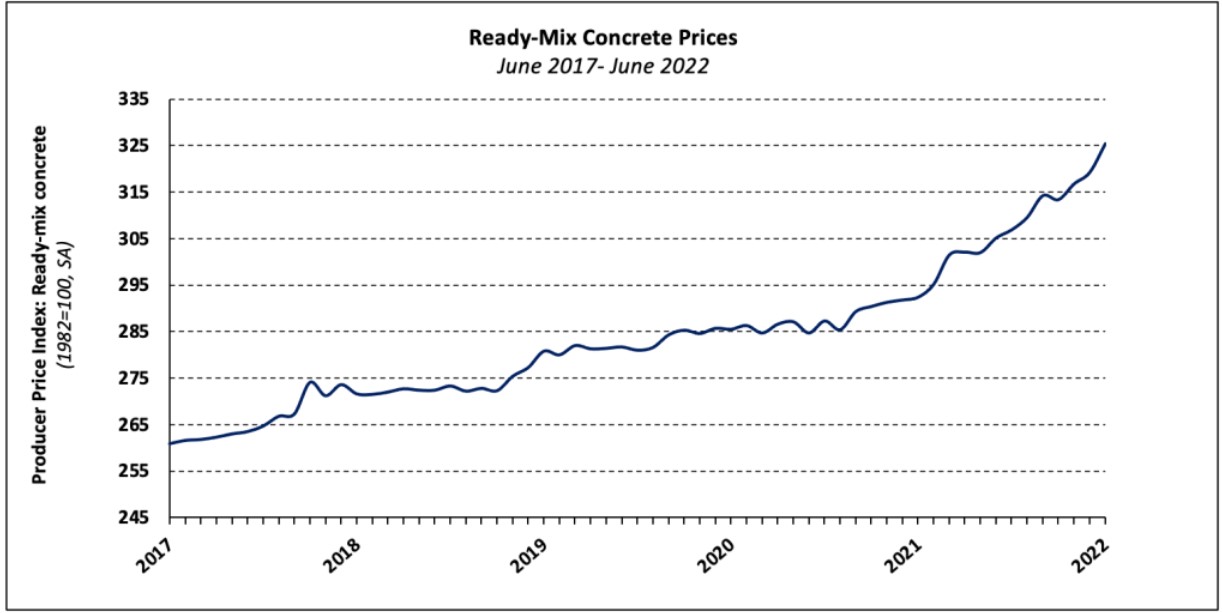
The PPI for ready-mix concrete (RMC) gained 1.9% in June following increases in May (+0.8%) and April (+1.1%). The index has climbed 5.1%, year-to-date, and 11.3% over the past 12 months. Over the two decades beginning January 2000, the price of RMC moved more than 1% in 24 of 240 survey months. It has increased/decreased more than 1% in seven of the 30 months since, including three times through the first half of 2022.
Price changes were broad based geographically but increased the most in the Northeast where they rose 6.3% in June. Prices also increased in the South (+0.9%), Midwest (+1.6%), and West (+1.0%). Although prices are higher than pre-pandemic levels in all regions, the variance of increases across regions is quite large, ranging from 10.6% in the Midwest to 23.2% in the West.

Gypsum Products
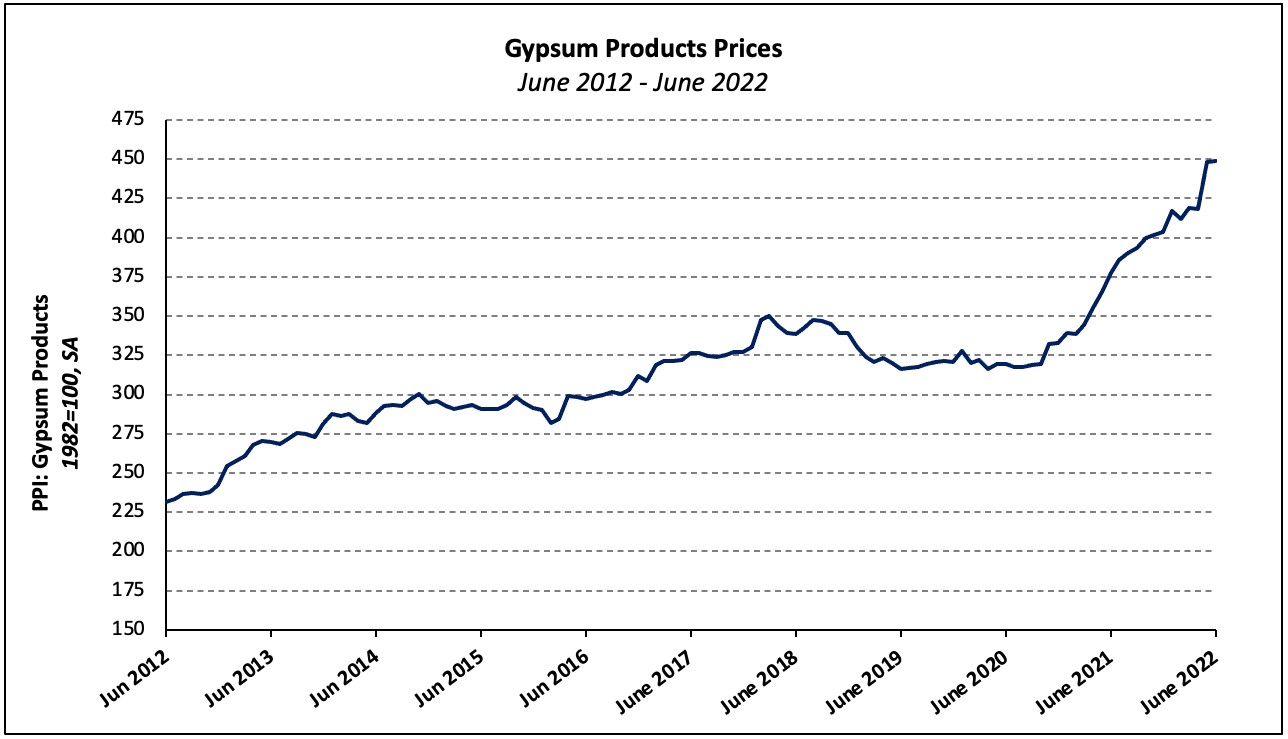
The PPI for gypsum products increased 0.1% in June after surging 7.1% in May. and has soared 22.6% over the past year. After a quiet 2020, the price of gypsum products climbed 23.0% in 2021 and is up 7.6% through the first half of 2022.
Steel Products
Steel mill products prices decreased 1.8% in June after increasing 13.6% over the two prior months. 10.7%. Although prices are 6.5% below their all-time high (reached in December 2021), they are twice January 2021 levels.

Paint
The PPI for architectural coatings (i.e., paint) was flat over the month as the price of exterior paint gained 0.1% and that of interior paint did not change. The PPI for paint has not declined since January 2021—the prices of exterior and interior paint have risen 49.3% and 33.2%, respectively, in the months since.
Transportation of Freight
The price of truck transportation of freight decreased 0.4% in June, the first monthly decline since May 2020. Since then, the indices for local and long-distance motor carrying prices are up 31.0%% and 46.5%, respectively.
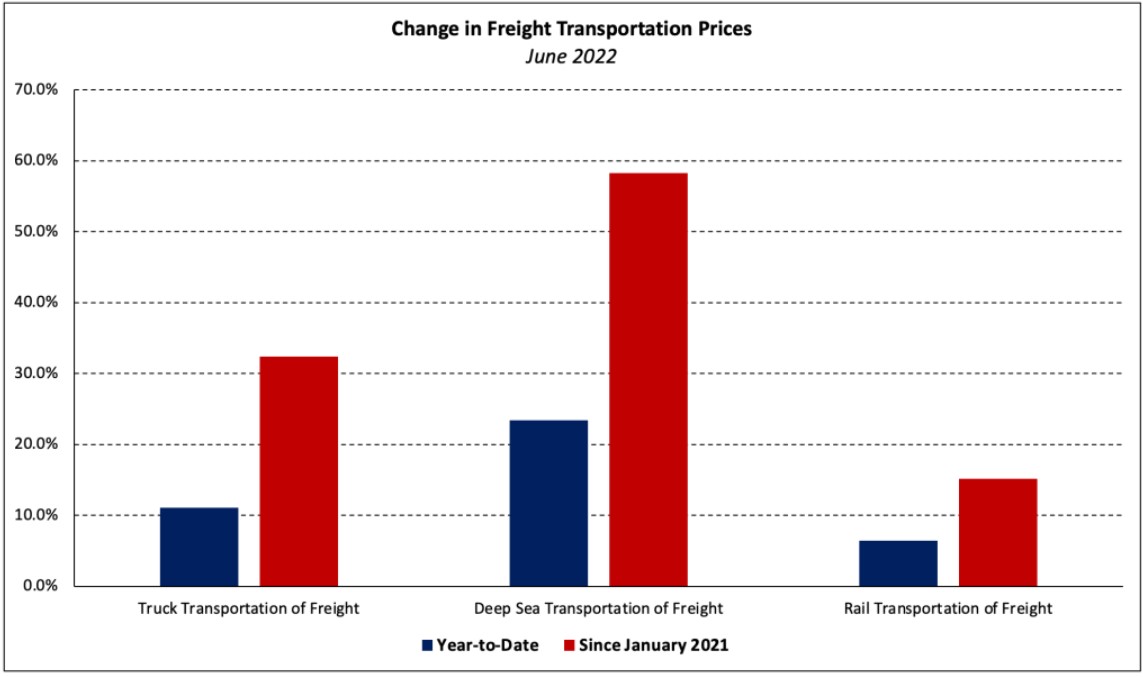
Water transportation costs declined 1.5% in June after increasing 21.6% over the prior two months. Deep sea (i.e., ocean) transportation of freight prices—which are 27.2% higher than they were in March—have accounted for most of the three-month increase as the category accounts for over half of the water transportation PPI. The price of deep sea water freight has climbed 57.8% since the spring of 2020.
Not only have freight costs increased, but the prices of services to arrange freight logistics have climbed steeply as well. Over the course of 2021, the PPI for the arrangement of freight and cargo increased 95.1%. Although prices have fallen nearly 12%, YTD, they remain 57.5% above pre-pandemic levels.
Other Building Materials
The chart below shows the 12-month and year-to-date price changes of other price indices relevant to the residential construction industry.

