Chart: Single-Family Starts Up 18.5% in May
Originally Published by: NAHB — June 20, 2023
SBCA appreciates your input; please email us if you have any comments or corrections to this article.
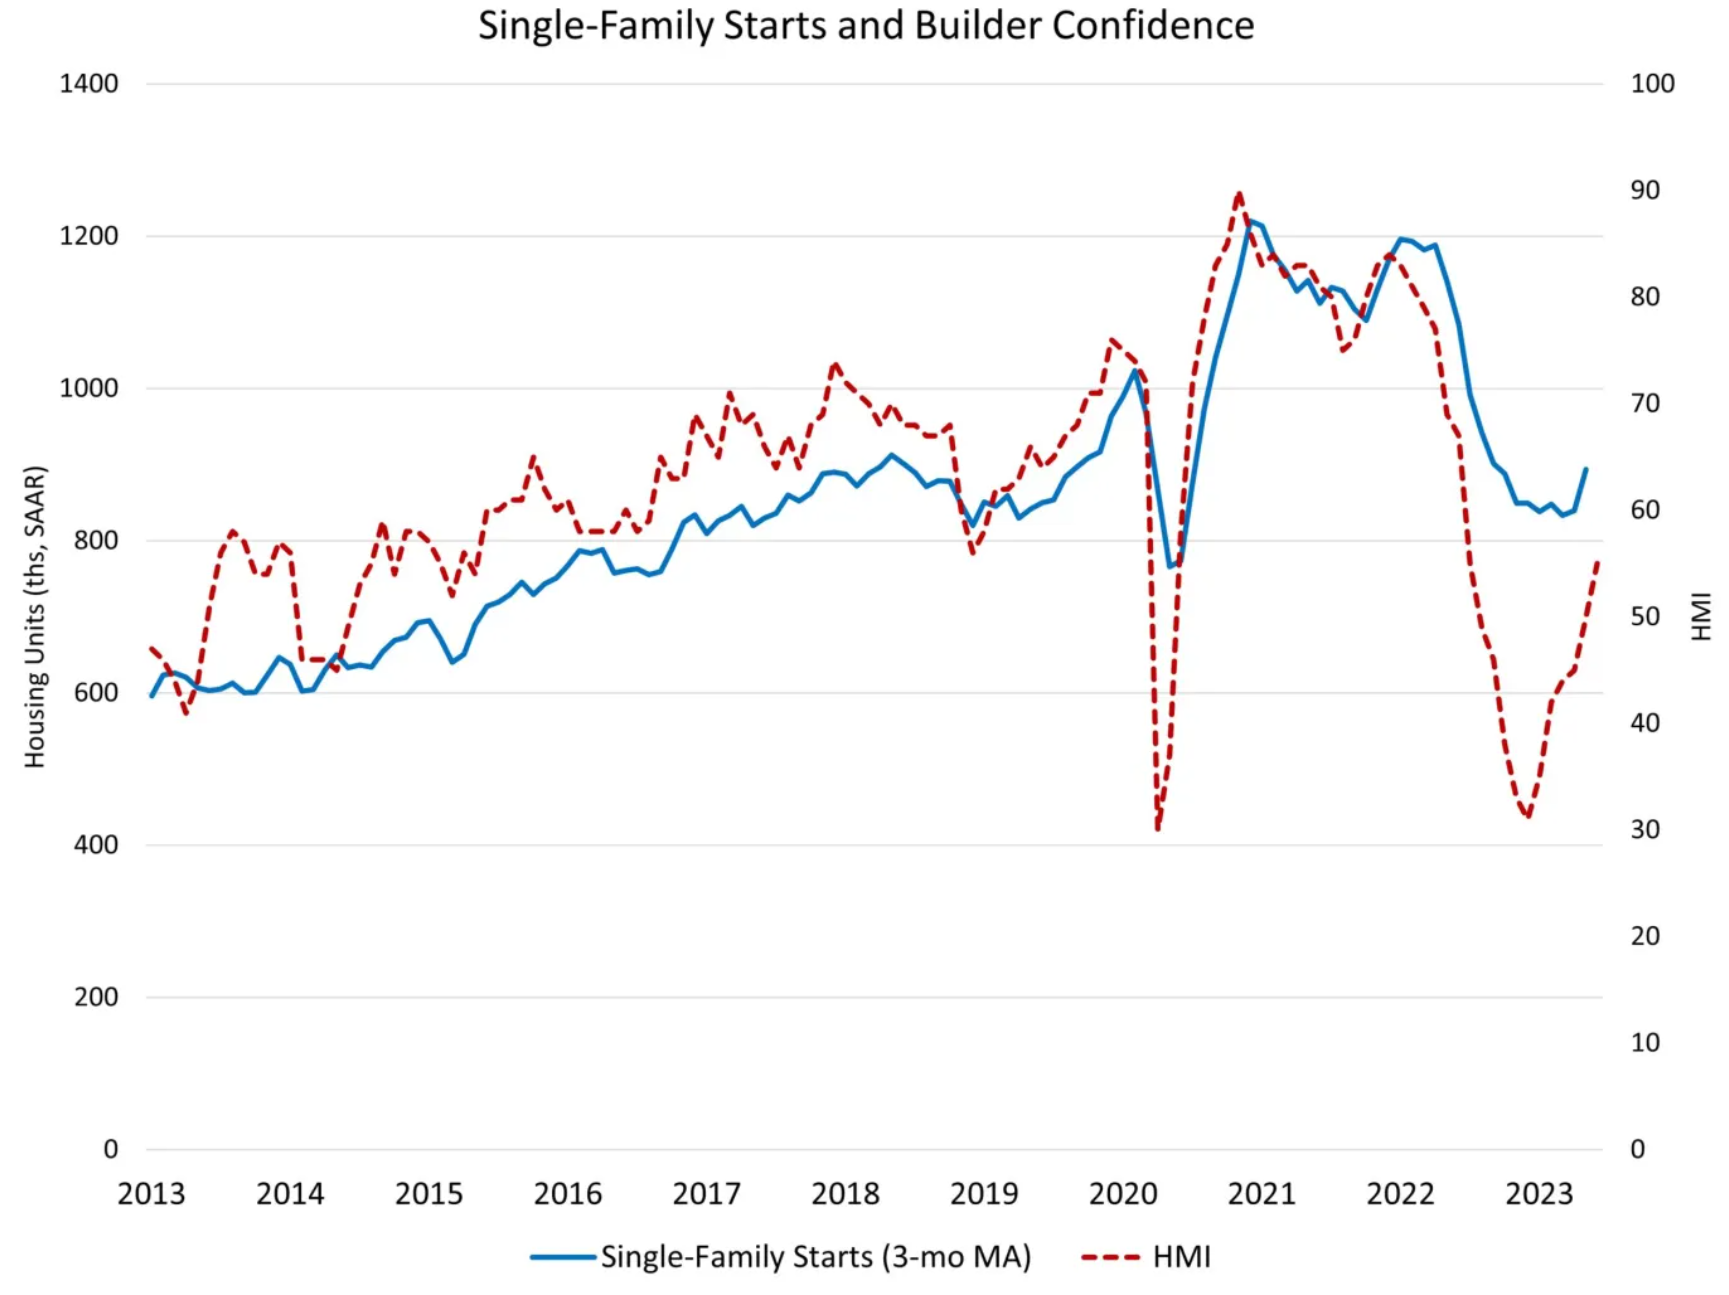
Limited existing inventory combined with solid demand and improving supply chains helped push single-family starts to an 11-month high in May. This occurred despite elevated interest rates and ongoing challenges for housing affordability.
Overall housing starts in May increased 21.7% to a seasonally adjusted annual rate of 1.63 million units, according to a report from the U.S. Department of Housing and Urban Development and the U.S. Census Bureau.
The May reading of 1.63 million starts is the number of housing units builders would begin if development kept this pace

The May housing starts data and the latest builder confidence NAHB/Wells Fargo HMI survey both point to a bottom forming for single-family residential construction earlier this year. There have been some improvements to the supply-chain, although challenges persist for items like electrical transformers and lot availability. However, due to weakness at the start of the year, single-family housing starts are still down 24% on a year-to-date basis.
And while single-family starts are down year-to-date, single-family completions are down just 1.2% as projects started at the end of last year finish. Additional housing supply is good news for inflation data, because more inventory will help reduce shelter inflation, which is now a leading source of growth for the CPI.
for the next 12 months. Within this overall number, single-family starts increased 18.5% to a 997,00 seasonally adjusted annual rate. However, this remains 6.6% lower than a year ago. The multifamily sector, which includes apartment buildings and condos, increased 27.1% to an annualized 634,000 pace.

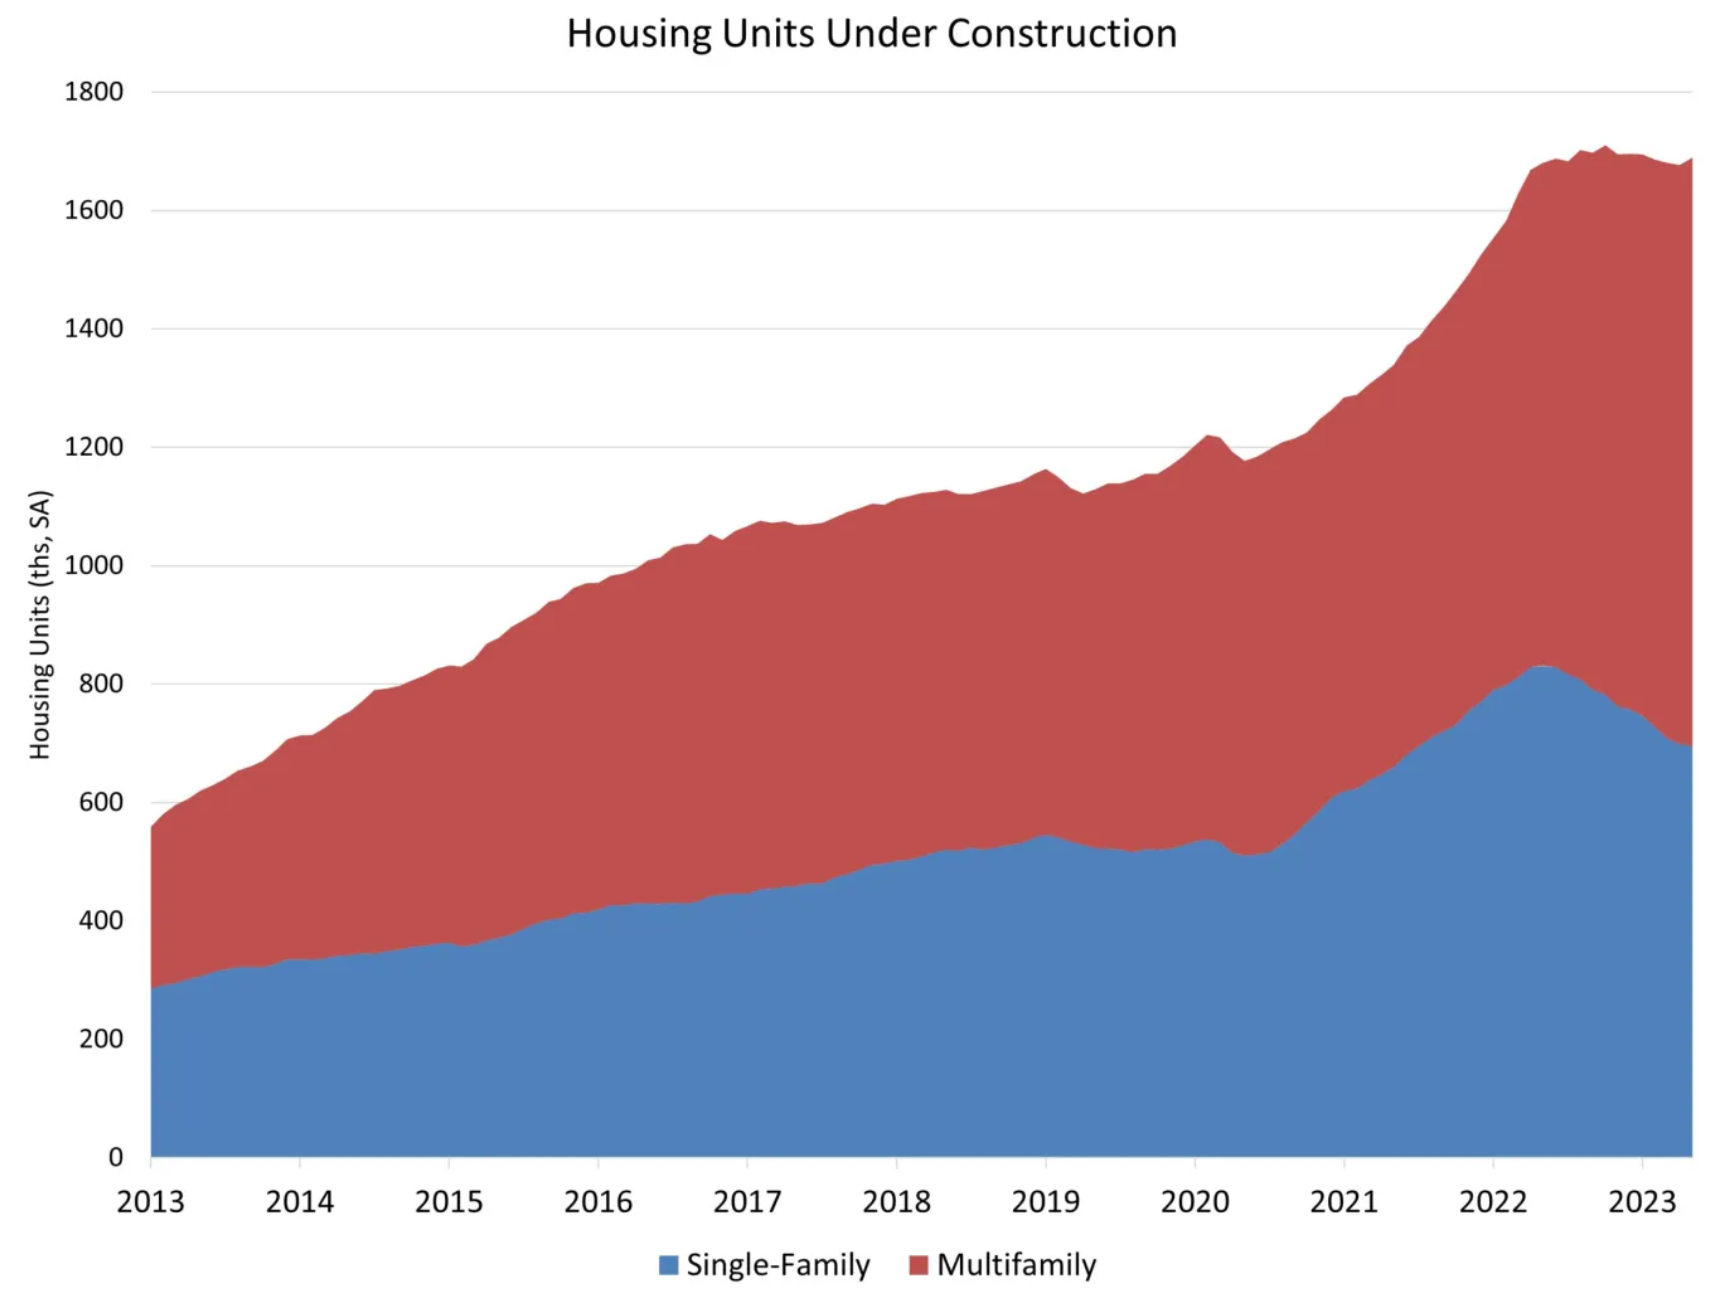
Of note, the May housing data shows that the number of single-family homes under construction is down 16% compared to a year ago at 695,000, while the number of apartments under construction is up 17% to 994,000—the highest level since September 1974. This level of inventory in the construction pipeline will eventually push multifamily construction starts lower.
On a regional and year-to-date basis, combined single-family and multifamily starts are 11.0% lower in the Northeast, 15.0% lower in the Midwest, 12.3% lower in the South and 24.7% lower in the West.
Overall permits increased 5.2% to a 1.49 million unit annualized rate in May. Single-family permits increased 4.8% to an 897,000 unit rate, but are down 25.5% year-to-date. Multifamily permits increased 5.9% to an annualized 594,000 pace.
Looking at regional permit data on a year-to-date basis, permits are 21.7% lower in the Northeast, 24.7% lower in the Midwest, 16.5% lower in the South and 24.1% lower in the West.
