Charts: Exurban Areas Doing Best During Housing Slowdown
Originally Published by: NAHB — December 5, 2023
SBCA appreciates your input; please email us if you have any comments or corrections to this article.
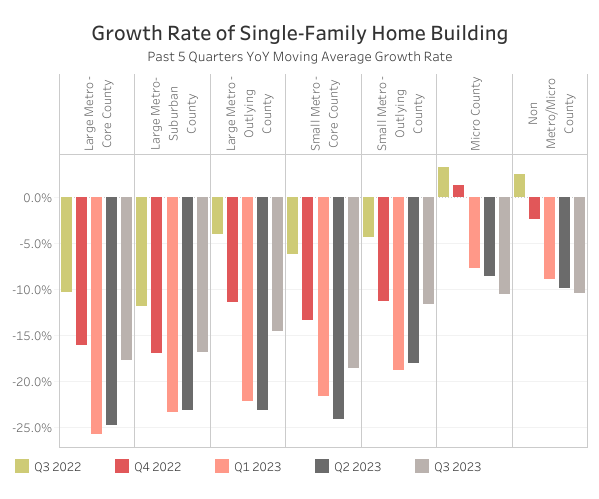
For the third consecutive quarter, single-family growth rates were negative for all geographic sectors of the nation, as exurban areas posted the largest increase in market share for both single-family and multifamily construction, according to the latest findings from the National Association of Home Builders (NAHB) Home Building Geography Index (HBGI) for the third quarter of 2023.

The lowest single-family year over year growth rate in the third quarter of 2023 occurred in small metro core counties, which posted a 18.6% decline. All large and small metro areas also had double-digit negative growth rates. The smallest decline was in Non metro/micro counties at 10.4%.
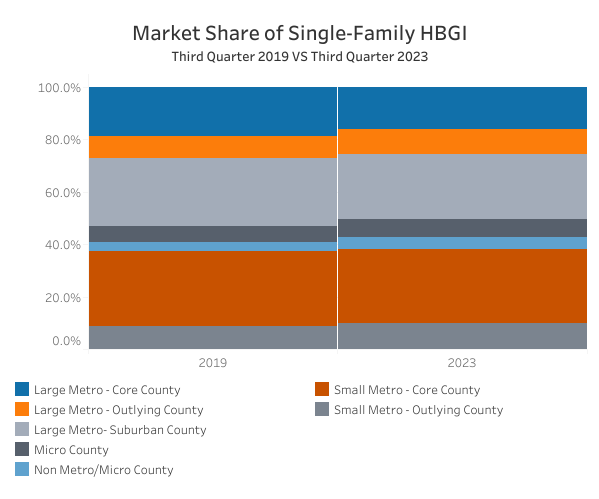
Meanwhile, large metro outlying counties posted the largest increase in single-family market share between the second quarter and third quarter of 2023, rising from 9.5% to 9.7%. The largest decrease in market share occurred in micro counties over the quarter, which fell from 7.2% to 7.0%. None of the market shares for the seven HBGI markets moved more than 0.2 percentage points between the second quarter and third quarter.

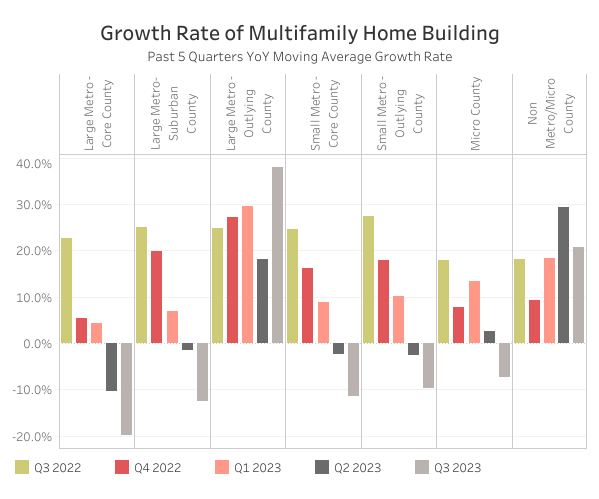
In the multifamily sector, large metro outlying counties had the highest growth rate in the third quarter, up a robust 37.9%. This was the ninth consecutive quarter of positive growth for this market. The only other area to featured high growth was in non metro/micro counties where growth was at 20.7% in the third quarter of 2023, the eleventh consecutive quarter that this market had positive growth. All other markets were negative, with the highest decline occurring in the large metro core counties down 19.8%.

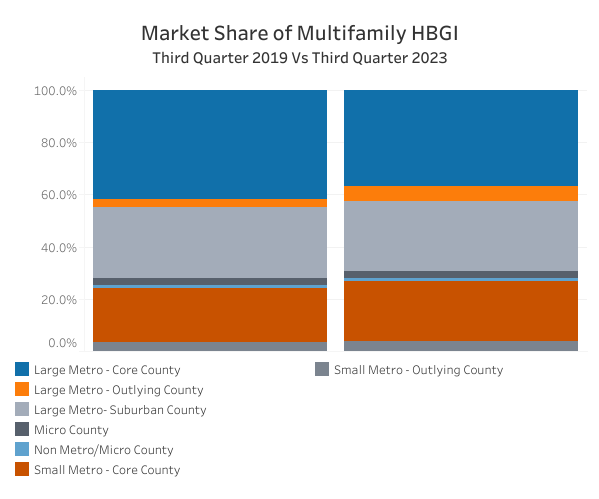
The biggest multifamily market by share, large metro core counties, continued to lose market share for the second straight quarter as it has fallen from 38.5% at the start of 2023 to 36.9% in the third quarter. This was by far the biggest drop in market share for any market. The biggest gainer so far in multifamily market share has been large metro outlying counties, up 1.2 percentage points to 5.5% market share. Nine consecutive quarters of building growth has helped increase this markets prevalence in multifamily construction.

The third quarter of 2023 HBGI data can be found at http://nahb.org/hbgi.
