Charts: Residential Construction Input Index Up 23%
Originally Published by: NAHB — June 17, 2021
SBCA appreciates your input; please email us if you have any comments or corrections to this article.
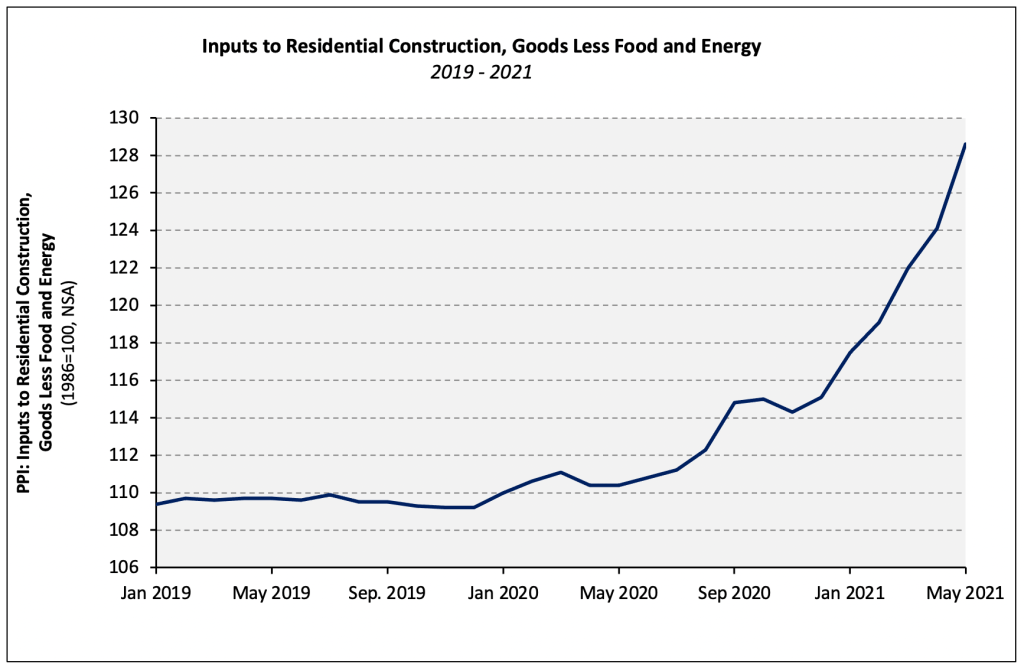
Prices paid for goods used in residential construction ex-energy rose 3.6% in May (not seasonally adjusted) and have increased 16.5% over the past 12 months, according to the latest Producer Price Index (PPI) report released by the Bureau of Labor Statistics. Building materials (i.e., inputs to residential construction less food and energy) prices have declined just twice since December 2019.
The index for inputs to residential construction, including food and energy, increased more (+4.1%) and is up 22.5%, year-over year. This increase closely mirrors the 26% increase found in a recent NAHB survey.
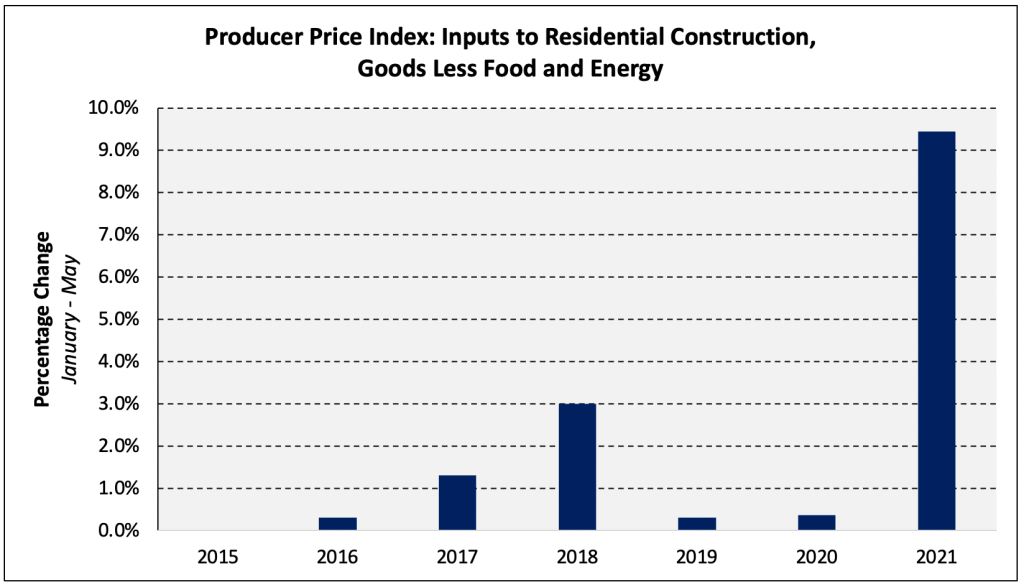
Building materials prices have increased 9.4% year-to-date (YTD), in stark contrast to the 0.4% YTD seen in 2020. However, the 2021 increase YTD is an outlier when compared to pre-pandemic years as well, more than tripling the largest January-to-May increase since 2015 (the most recent data available).
Steel Products
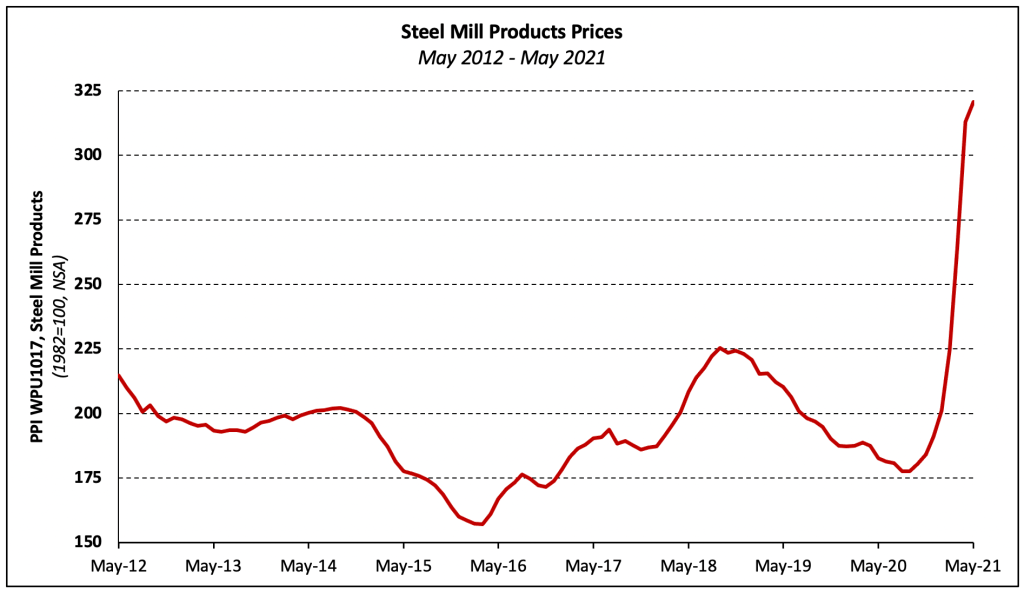
Steel mill products prices climbed 2.4% in May, a substantial slowdown after three months during which increases averaged 15.9%. Even so, prices are up 75.4% over the past 12 months and have risen 59.4% in 2021 alone.
Softwood Lumber
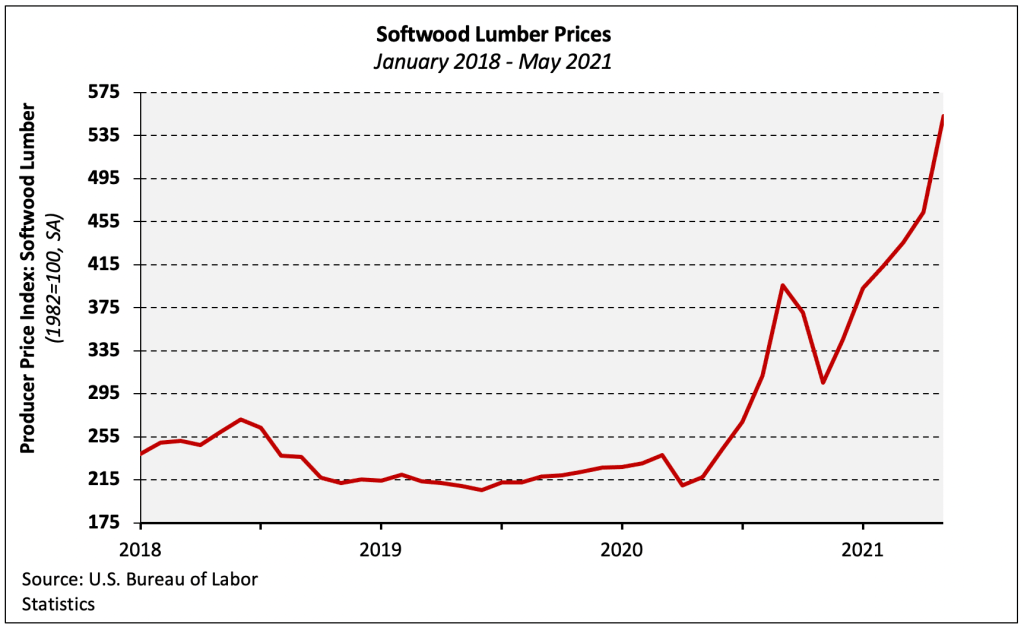
The PPI for softwood lumber (seasonally adjusted) rose 19.2%–the largest monthly increase since September 2020—and set a record high for the fourth consecutive month. Lumber prices have remained extremely volatile since the 88.5% increase between April and September 2020.
Since falling 22.9% between September and November, the softwood lumber PPI has risen 81.2%. However, recent data from Random Lengths suggests that the index will decline next month as weakening prices in late-May and the first half of June are captured by the BLS survey.
Lumber Futures
Good news has been found in the futures market of late, as July lumber futures have fallen precipitously in recent weeks. Since May 10, the price of July futures has declined 44.2%. It is worth noting the features of lumber futures as they explain why changes in the futures market may not be a practical leading indicator of how much builders will pay for framing packages in the weeks or months ahead.
First, the middle of the supply chain (i.e. wholesalers, distributors) must protect against upside risk. For sure, these supply chain members must still sell inventories if futures and/or mill prices fall. But the current cash or futures price has little effect on prices paid by builders until prices have fallen to a sufficiently low level for long enough to counteract middlemen being “trigger shy” in an environment of falling mill prices.
A second, ancillary reason involved the details of futures contracts. The specifications of lumber futures contracts state that a futures contract:
- Is for delivery of roughly 110,000 board feet (all of which is made up 2x4s), assuming the future is held to delivery.
- Only delivers lumber that is manufactured in California, Idaho, Montana, Nevada, Oregon, Washington, Wyoming, or Alberta or British Columbia, Canada.
- Is limited to Hem-Fir, Englemann Spruce, Lodgepole Pine, and/or Spruce-Pine-Fir. Southern Yellow Pine is notably absent.
Thus, lumber futures do not mimic (nor could they) the mix of products quoted by suppliers and paid for by builders. That is simply how they are designed.
Exchange Rate Effects
In addition to nominal price movements and tariffs on Canadian lumber, cross-border purchasers are affected by the strength of the U.S. dollar relative to the Canadian dollar.
The USD has depreciated 4.8% YTD and 10.3% over the past 12 months which has raised the price of Canadian imports in real terms above nominal increases due to other market forces.
Gypsum Products
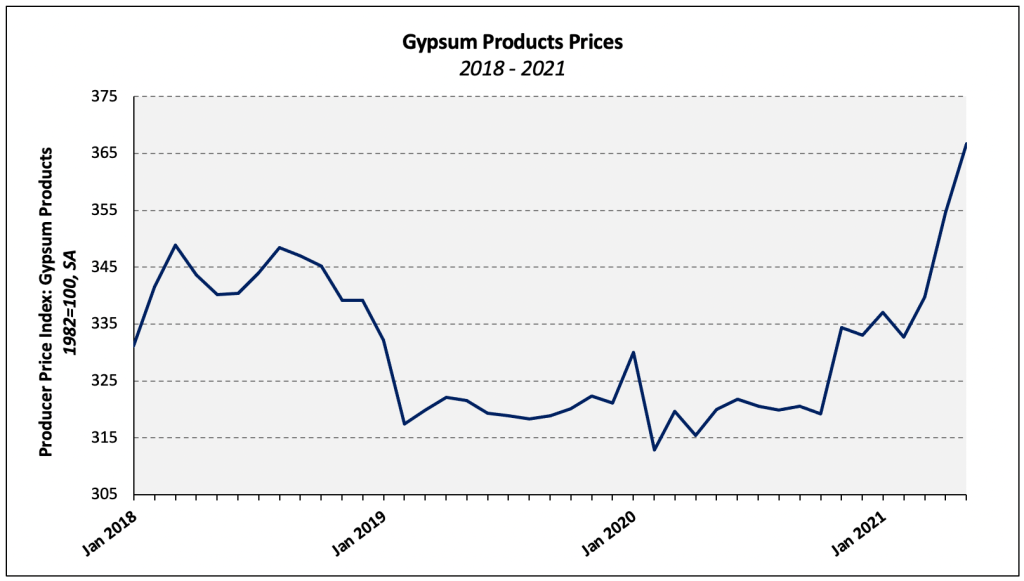
Prices paid for gypsum products increased 3.4% in May, reaching a record high for the second consecutive month. The index has climbed 14.6% over the past year, but the whole of that increase has occurred since October 2020. The index for gypsum building materials (e.g., drywall) has increased 17.9% since last October.
Ready-Mix Concrete
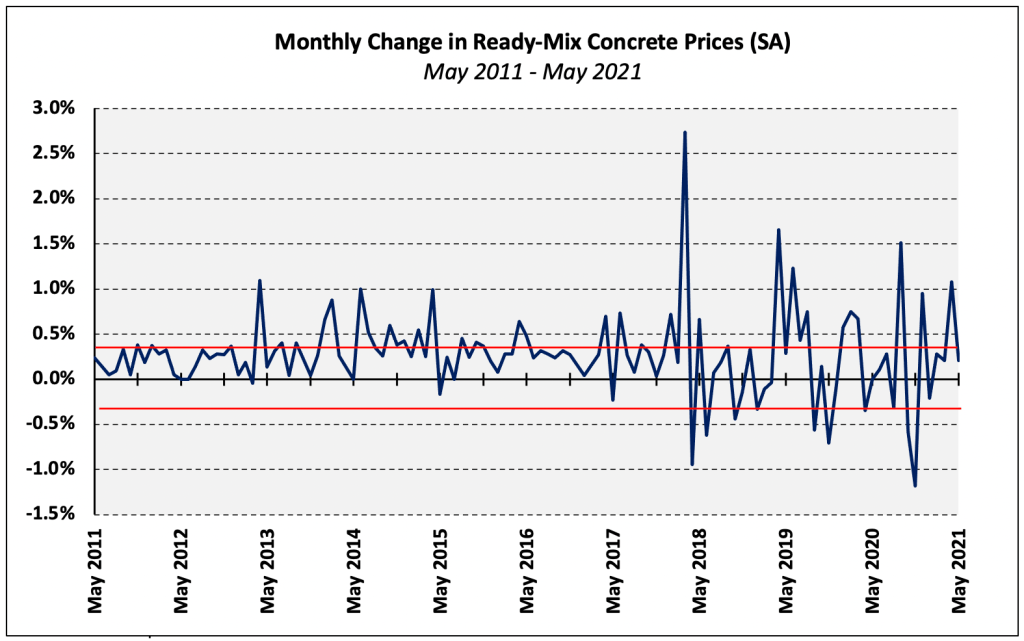
Prices paid for ready-mix concrete (RMC) climbed 0.2% (seasonally adjusted), following a 1.1% increase in April. Price volatility has eased in 2021 as four of the five monthly price changes YTD have been between -0.2% and 0.3%.
Prices increased in the Northeast (+2.3%) and South (+0.2%) regions in May, while prices paid in the Midwest (-1.1) and South (-0.4%) declined.
Other Building Materials
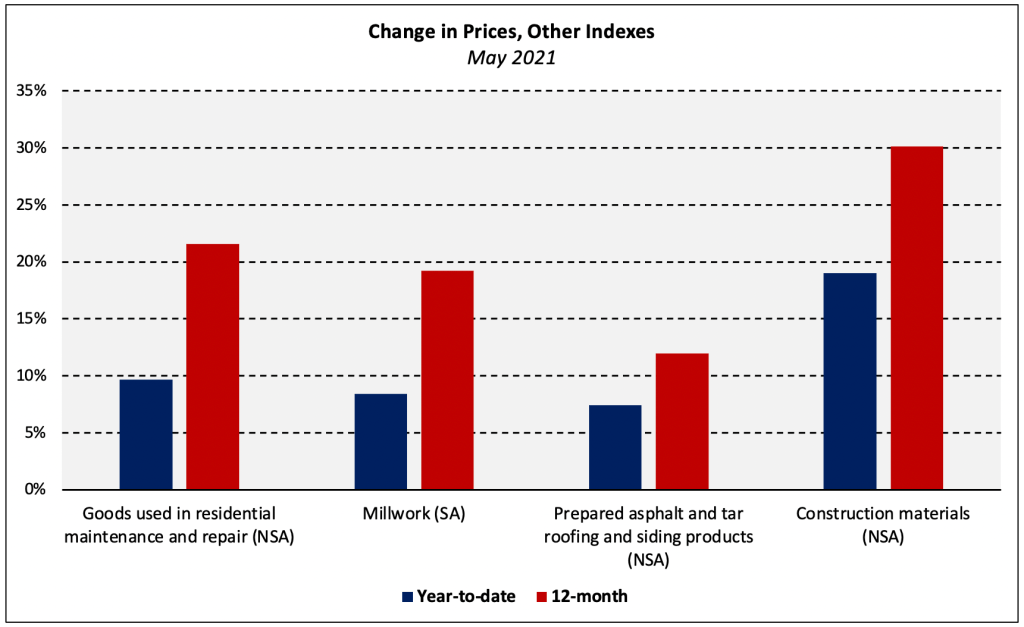
The chart below shows the 12-month and year-to-date price changes of other price indices relevant to the residential construction industry. As Congress continues to work on an infrastructure package, the Construction Materials index is particularly salient. This index is much more heavily weighted with products necessary and used in large amounts in the production of “traditional” infrastructure (e.g., roads, bridges, rail).

