Charts: Will High Costs Impact Interest in New Homes?
Originally Published by: NAHB — July 23, 2021
SBCA appreciates your input; please email us if you have any comments or corrections to this article.
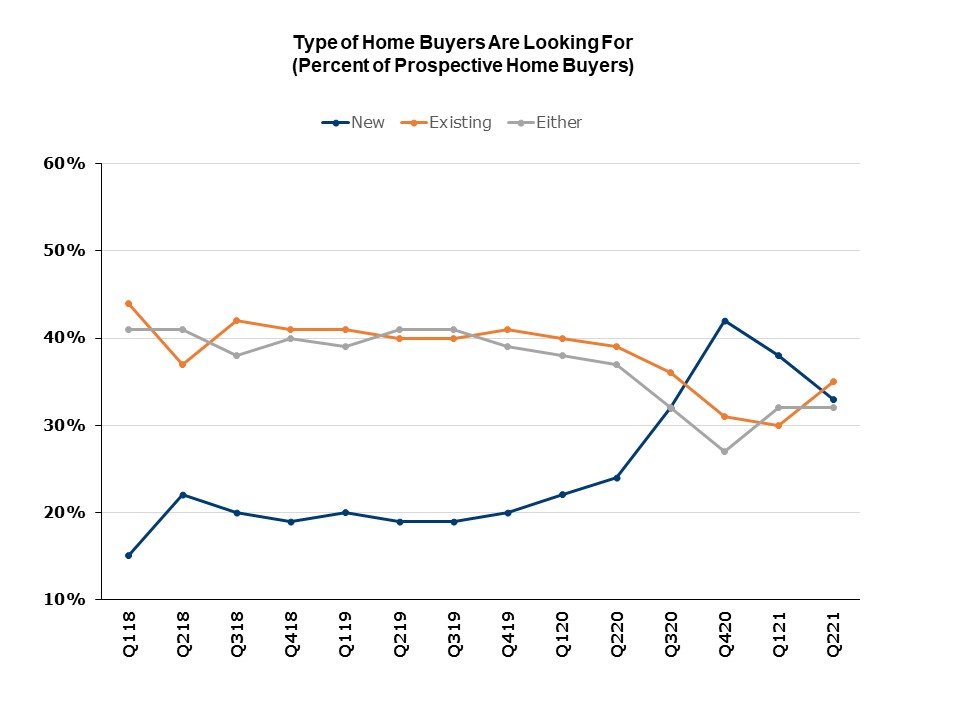
The share of prospective home buyers looking to buy a newly-built home peaked at 42% in the fourth quarter of 2020, before falling to 38% and 33%, respectively, in the first two quarters of 2021. The drop is most likely the direct result of strong gains in new home prices in 2021, which have been driven by double-digit growth in the price of residential construction inputs. These results come from NAHB’s latest Housing Trends Report.
In contrast, the share of buyers looking only at existing homes rose from 31% in the final quarter of 2020 to 35% in the second quarter of 2021, while those who will buy either new or existing increased from 27% to 32% of all prospective buyers during this period.

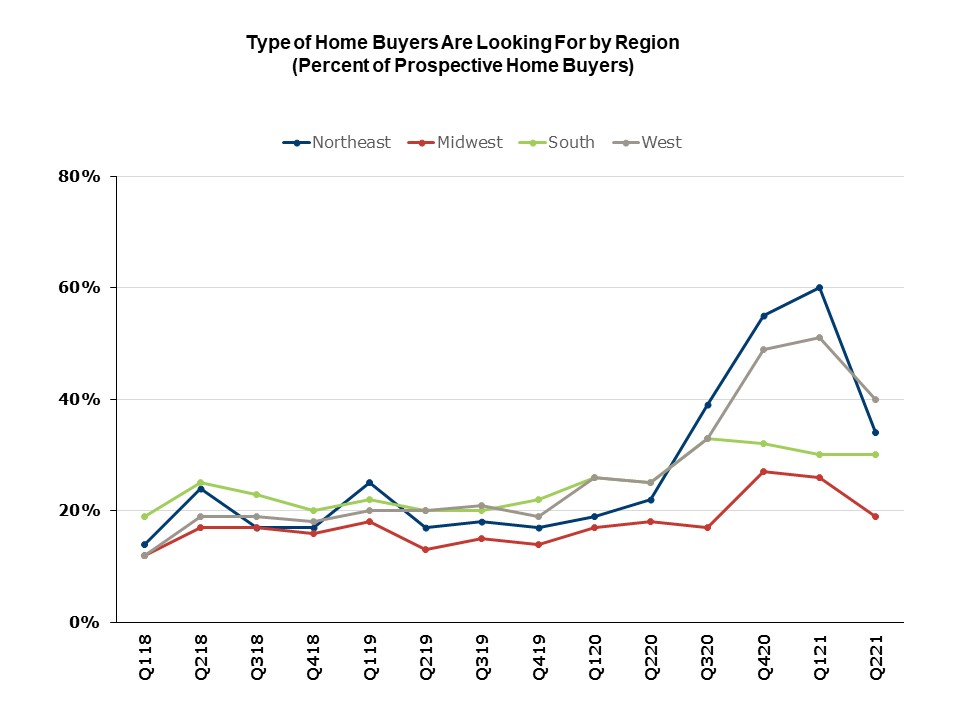
Regionally, the share of buyers who would prefer a new home peaked in the Northeast and West in the first quarter of 2021 at 60% and 51%, respectively, before falling to 34% and 40% in the second quarter of the year. In the South, the share peaked in the third quarter of 2020 at 33%, but is now at 30%. In the Midwest, the share peaked in the final quarter of 2020 at 27%, but is now down to 19%.

* All national and regional series in the HTR were seasonally adjusted for the first time in the second quarter of 2021. As a result, all data prior to this quarter have changed, as they now reflect the seasonal adjustments. Moving forward, non-seasonally adjusted data will no longer be published.
The Housing Trends Report is a research product created by the NAHB Economics team with the goal of measuring prospective home buyers’ perceptions about the availability and affordability of homes for-sale in their markets. The HTR is produced quarterly to track changes in buyers’ perceptions over time. All data are derived from national polls of representative samples of American adults conducted for NAHB by Morning Consult. Results are seasonally adjusted. A description of the poll’s methodology and sample characteristics can be found here.

