Maps: How National Builders’ Share of Major Metros is Increasing
Originally Published by: NAHB — November 7, 2022
SBCA appreciates your input; please email us if you have any comments or corrections to this article.
NAHB analysis of information published in Builder Magazine’s annual Local Leaders lists shows that large builders gained market share across all tiers on average from 2009 to 2021 in major housing markets; market concentration, as calculated with top four firms in a metropolitan statistical area (MSA), has also increased, but has leveled off over the last four years.
Figure 1 shows the annual average of the four statistics produced by NAHB for this analysis, which showcases how these averages changed during the years following the Great Recession. For reference, the Great Recession occurred between December 2007 and June 2009 according to the National Bureau of Economic Research (NBER).

All four percentages have increased since the trough of the Great Recession. The four firm concentration ratio started at 30.1% in 2009, peaked in 2020 at 43.7%, and declined slightly to 43.0% in 2021. The large national builders grew their market shares from 30.5% in 2009 to its current peak of 48.4% in 2021. The market share for all national builders went up from 33.8% in 2009 to its current peak of 53.6% in 2021. National and regional builders increased their collective market share on average from 37.3% in 2009 to its peak of 57.5% in 2021.
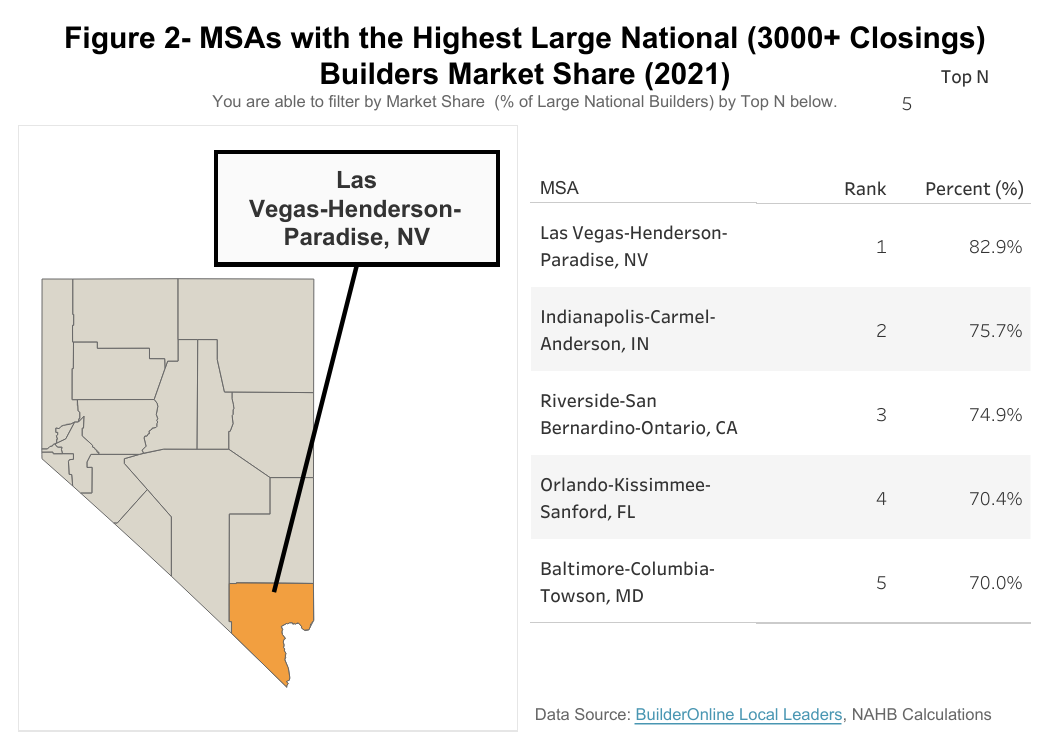
NAHB calculated the percentage for all four statistics for the most recent year available (2021) by MSA. As an example, Figure 2 shows the MSAs in 2021 with the highest large national builder market shares. For reference, the average large national builder market share for all the analyzed MSAs in 2021 is 48.4%.

Las Vegas-Henderson-Paradise, NV had the largest national builder share at 82.9% for 2021. This is unsurprisingly when analyzing the Local Leaders data for this MSA. Nine of the top 10 builders for Las Vegas-Henderson-Paradise, NV are classified as Tier 1 (i.e., 3,000+ closings); this share composition is true for Riverside-San Bernardino-Ontario, CA as well.
NAHB also calculated the percentage change of these four statistics to understand how the COVID-19 pandemic affected each one and which companies “moved the needle” the most within MSAs. As an example, Figure 3 shows the large national builder market shares in 2019 and 2021 along with top five and bottom five MSAs by percent change.

Colorado Springs, CO saw the largest positive percent change in large national builder market share, growing over five-fold from 3.7% in 2019 to 19.1% in 2021. All MSAs within the top five have a large national builder market share of less than 50%. Atlanta-Sandy Springs-Alpharetta, GA experienced the largest negative percent change, falling 12.2% from over 42.5% in 2019 to 37.3% in 2021.
Interestingly, both MSAs in Colorado saw noticeable shifts among specific large national builders. Most of the increase in large national builder market share for Colorado Springs, CO came from the introduction of 2 firms in 2021 to the market: Clayton Properties (9.8%, or 407 closings) and D.R. Horton (3.0%, or 123 closings). M.D.C. Holdings previously had a strong presence within Colorado Springs, CO but fell out of the top ten starting in 2015; however, they have remerged in 2021, achieving a market share of 3.2%, or 131 closings, and ranked 8th. As for Greeley, CO, D.R. Horton (+5.6 percentage points to 16.7%, or 630 closings) and LGI Homes (+7.7 percentage points to 11.3%, or 425 closings) were the largest drivers of their increases in large national builder market shares.
For a more detailed description of NAHB’s analysis of MSA builder market shares and concentration along with further insights, click on the link to access the full report where you will find MSA rankings for each of the four statistics, both for 2021 and percentage change from 2019 to 2021, and additional concentration analysis.
