Top 10 Builders Accounted for 34.2% of Single-Family Closings
Originally Published by: NAHB — June 29, 2022
SBCA appreciates your input; please email us if you have any comments or corrections to this article.
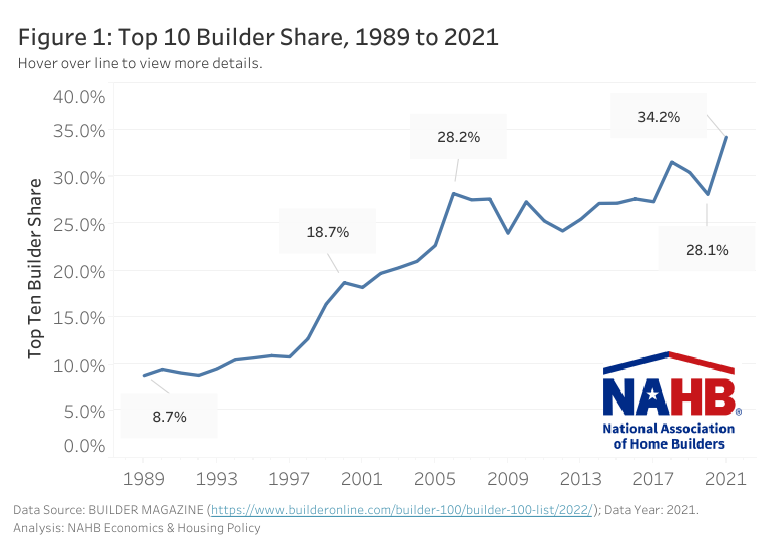
The top 10 builders captured 34.2% of new single-family home closings in 2021, the highest percentage on record based on data released by BUILDER Magazine. This share represents 264,426 closings out of the 774,000 new single-family home sales reported by the U.S. Census in 2021. Nevertheless, these closings only represent 23.5% of single-family starts, a broader measure of home building that includes (not-for-sale) home construction.
Data for the past three decades reveals a continued upward trend in the top 10 builder share. In 1989, the top 10 builders captured 8.7% of closings. By the year 2000, the share was 18.7%; and by 2018, 31.5%. After edging down in both 2019 and 2020, the share jumped to a record-high 34.2% in 2021. (Figure 1)

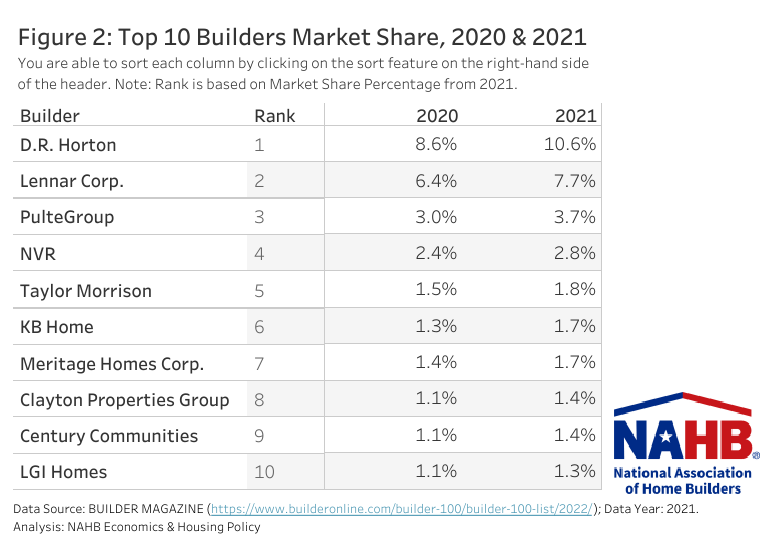
While the mix of companies within the top 10 remained unchanged from 2020 to 2021 (Figure 2), there was one change with regards to ranking; KB Homes and Meritage Homes Corp switched ranks, with the former rising to the sixth position while the latter is now seventh. D.R. Horton remains the top builder for 2021, capturing 10.6% of the market with 81,981 closings. This is the 20th straight year that D.R. Horton has occupied the top spot. Lennar is ranked second with 7.7% in market share and PulteGroup is third with 3.7%. This is the second year that the Top Three builders (D.R. Horton, Lennar, and PulteGroup) have a combined market share of over 20% (2018: 20.4% and 2021: 22.0%).

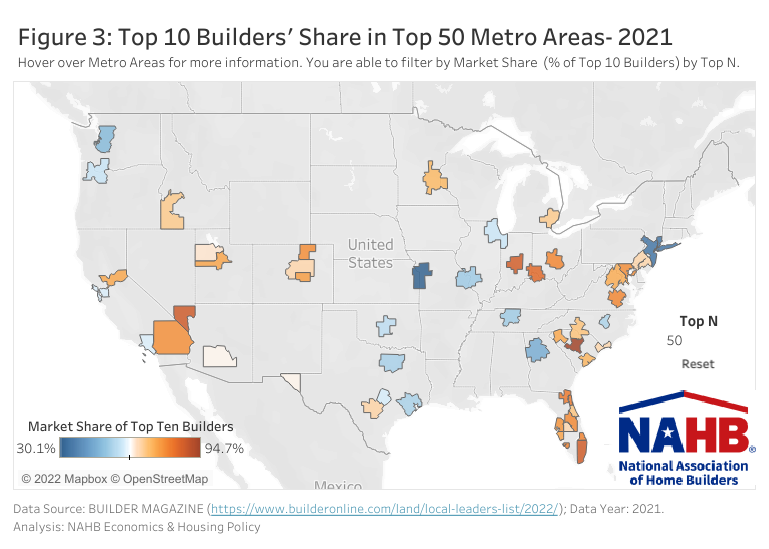
BUILDER Magazine also released Local Leaders data on the top 10 builders in the top 50 largest new-home markets in the U.S. (ranking determined by the number of single-family permits) (Figure 3). The 2021 data shows that the top 10 builders in each of the 50 markets captured at least 30.1% of the market share (Kansas City, MO-KS) and reached as high as 94.7% (Columbia, SC), with an overall average of 68.1%.
Analyzing the map in more detail shows clusters of metro-markets in Florida, Indiana, Maryland, Ohio, South Carolina, and Virginia with highly concentrated markets. Less concentrated markets include metro areas in Texas and metros in the Midwest region.

Among the builders, D.R. Horton had a presence in 41 of the top 50 metro areas in 2021, followed by Lennar and PulteGroup with 37 and 31 appearances, respectively. From 2020 to 2021, 24 metro areas saw an increase in their top 10 builders’ market share and 23 metro areas saw decreases. The top 5 metro areas with the biggest increases were:
- Salt Lake City, UT (+17.4 percentage points)
- Miami-Fort Lauderdale-Pompano Beach, FL (+17.1 percentage points)
- Columbia, SC (+9.5 percentage points)
- Provo-Orem, UT (+9.5 percentage points)
- Portland-Vancouver-Hillsboro, OR-WA (+6.1 percentage points)
The top 5 metro areas with the biggest decreases in the top 10 builders’ market share were:
- St. Louis, MO-IL (-15.3 percentage points)
- Richmond, VA (-14.7 percentage points)
- Charleston-North Charleston, SC (-13.9 percentage points)
- Columbus, OH (-12.4 percentage points)
- North Point-Sarasota-Bradenton, FL (-9.7 percentage points)
