Chart: Multifamily Sentiment Turns a Corner
Originally Published by: NAHB — February 23, 2023
SBCA appreciates your input; please email us if you have any comments or corrections to this article.
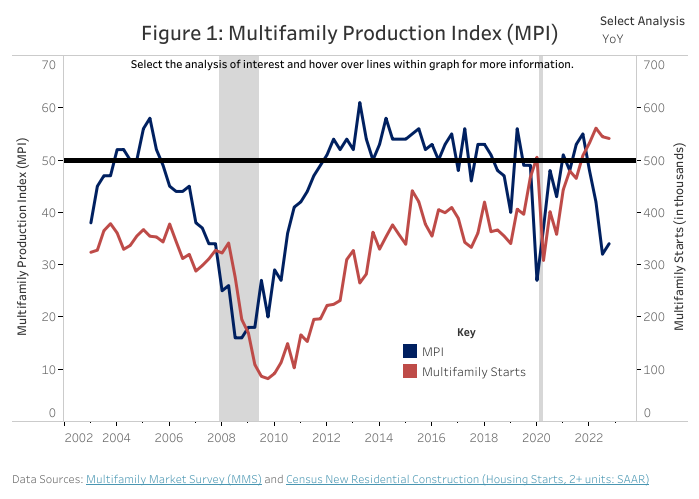
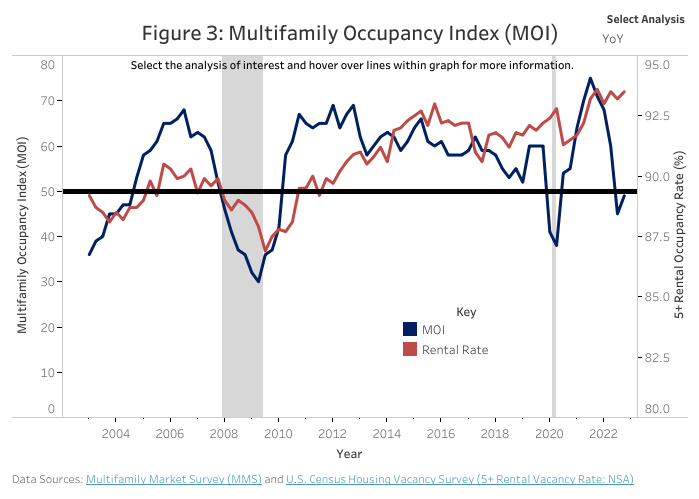
While the two main confidence indexes for multifamily housing increased slightly in the fourth quarter, they both remain in negative territory, according to results from the Multifamily Market Survey (MMS) released today by the National Association of Home Builders (NAHB). The MMS produces two separate indices. The Multifamily Production Index (MPI) increased two points to 34 compared to the previous quarter and the Multifamily Occupancy Index (MOI) increased four points to 49.
Even though many multifamily developers continue to see strong demand, the supply in some markets is beginning to catch up as evident by multifamily starts greatly outpacing completions (NAHB forecasts that multifamily production will slow measurably over the next two years from the very strong rates it sustained through most of 2022.). Developers still face major headwinds such as regulatory costs which can account for over 40 percent of the cost of development and the inability to obtain financing for new construction due to the continued rise in interest rates.

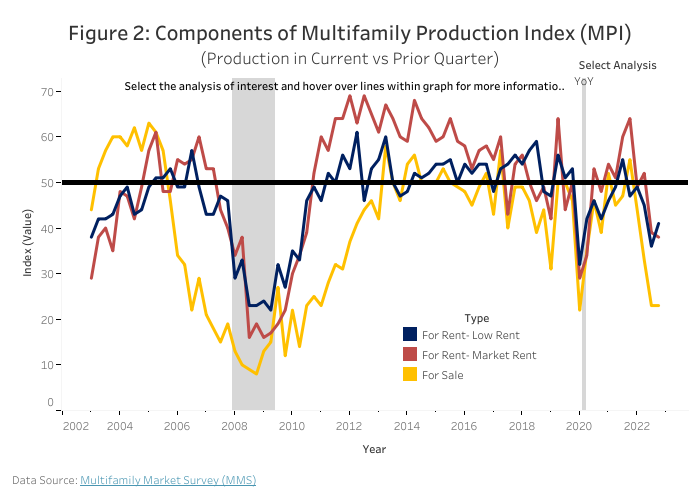
The MPI is a weighted average of three key elements of the multifamily housing market: construction of low-rent units-apartments that are supported by low-income tax credits or other government subsidy programs; market-rate rental units-apartments that are built to be rented at the price the market will hold; and for-sale units—condominiums. The component measuring low-rent units increased 5 points to 41, the component measuring market rate apartments dropped 1 point to 38 and the component measuring for-sale units remained even at 23.

The MOI measures the multifamily housing industry’s perception of occupancies in existing apartments. It is a weighted average of current occupancy indexes for class A, B, and C multifamily units, and can vary from 0 to 100, with a break-even point at 50, where lower numbers indicate decreased occupancy. The MOI increased 4 points to 49, indicating that the market is close to being stable.

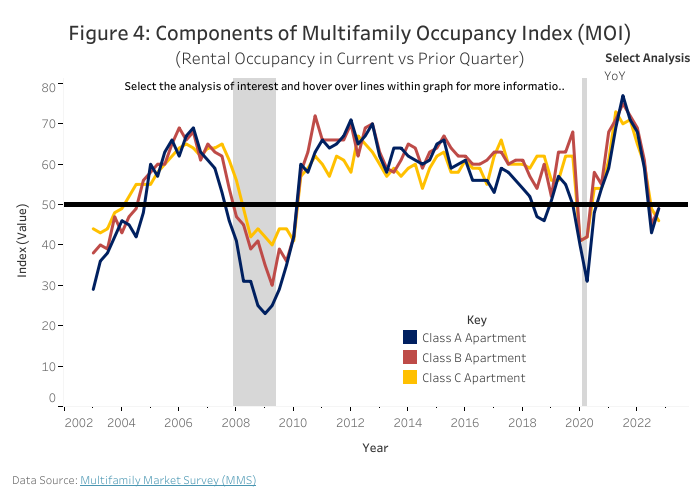
Results for the MOI’s components saw improvement for Class A (up 6 points to 49) and B apartments (up 4 points to 49), while Class C apartments saw a slight decrease, falling 3 points to 46.

For complete results from the Multifamily Market Survey, including the history of each index and its components back to the survey’s inception in 2003, please visit NAHB’s MMS web page.
