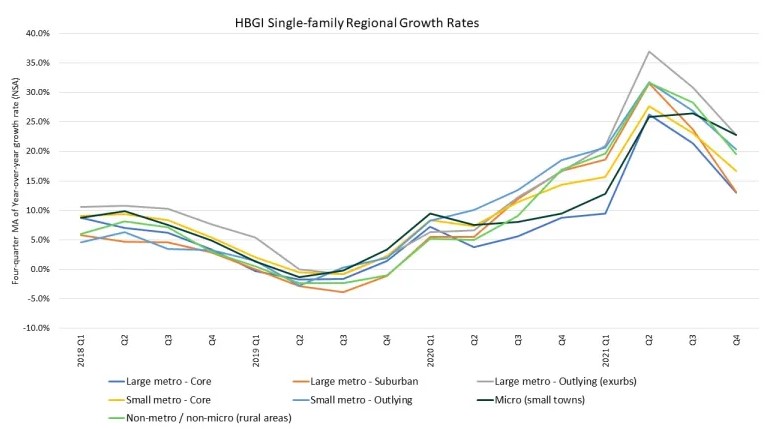
Chart: Single-Family Growth Rate Slows Across U.S.
Originally Published by: NAHB — March 8, 2022
SBCA appreciates your input; please email us if you have any comments or corrections to this article.
Per the latest results of NAHB’s Home Building Geography Index (HBGI), single-family home building showed higher growth rates across all regional submarkets in the fourth quarter of 2021, relative to the fourth quarter of 2020. Quarterly growth, however, trended downwards for all regions in the third and fourth quarters of 2021. Supply-side constraints and expectations of rising interest rates, particularly in the last few weeks of the year, were key contributors to the decline.
Single-family home building in the fourth quarter was a continuation of what began in the third quarter of 2021. In the third quarter of 2021, as more workers transitioned back to the workplace, single-family home building received a small boost in higher density urban core and exurban areas. Prospective buyers sought more space and took advantage of still low interest rates, relative to pre-pandemic levels. It was an anemic gain amid higher material costs weakening permit issuances in other Regions. This trend continued into the rest of the year.

The supply-side factors limiting growth across all geographies consisted of ongoing labor shortages, delayed construction times, and limited availability of building materials, all remnants of the public health crisis. Large metro core counties’ year-over-year growth rates fell from 26.3% in the second quarter to 13.0% in the fourth quarter, large metro suburban counties from 31.6% to 13.2%, large metro outlying counties (exurbs) from 37.0% to 22.8%, and small metro core counties from 27.7% to 16.7%. Small metro outlying counties fell from 31.8% in the second quarter to 20.3% in the fourth quarter. Micro counties and non-metro / non-micro counties fell from 25.9% and 31.6% to 22.8% and 19.5%, respectively.
Higher density areas’ combined market shares decreased in the fourth quarter of 2021 to 41.7%, compared to 42.4% in the second quarter of 2021 and 43.2% in the fourth quarter in 2020. Lower density areas’ combined market shares, including large metro areas’ exurbs, increased for the same comparison periods to 58.3%. Non-metro, non-micro counties had the lowest regional market share at 4.2%, consistent with their market shares in prior quarters even after a 12.1 percentage point decline in growth rate between the second and fourth quarters. The other regions’ market shares, by contrast, showed significantly more variation, during the pandemic as well as historically.
The HBGI data are non-seasonally adjusted. More information about the HBGI can be found here.
