Charts: Building Material Cost Growth Slowing, Inflation Easing
Originally Published by: NAHB — July 13, 2023
SBCA appreciates your input; please email us if you have any comments or corrections to this article.
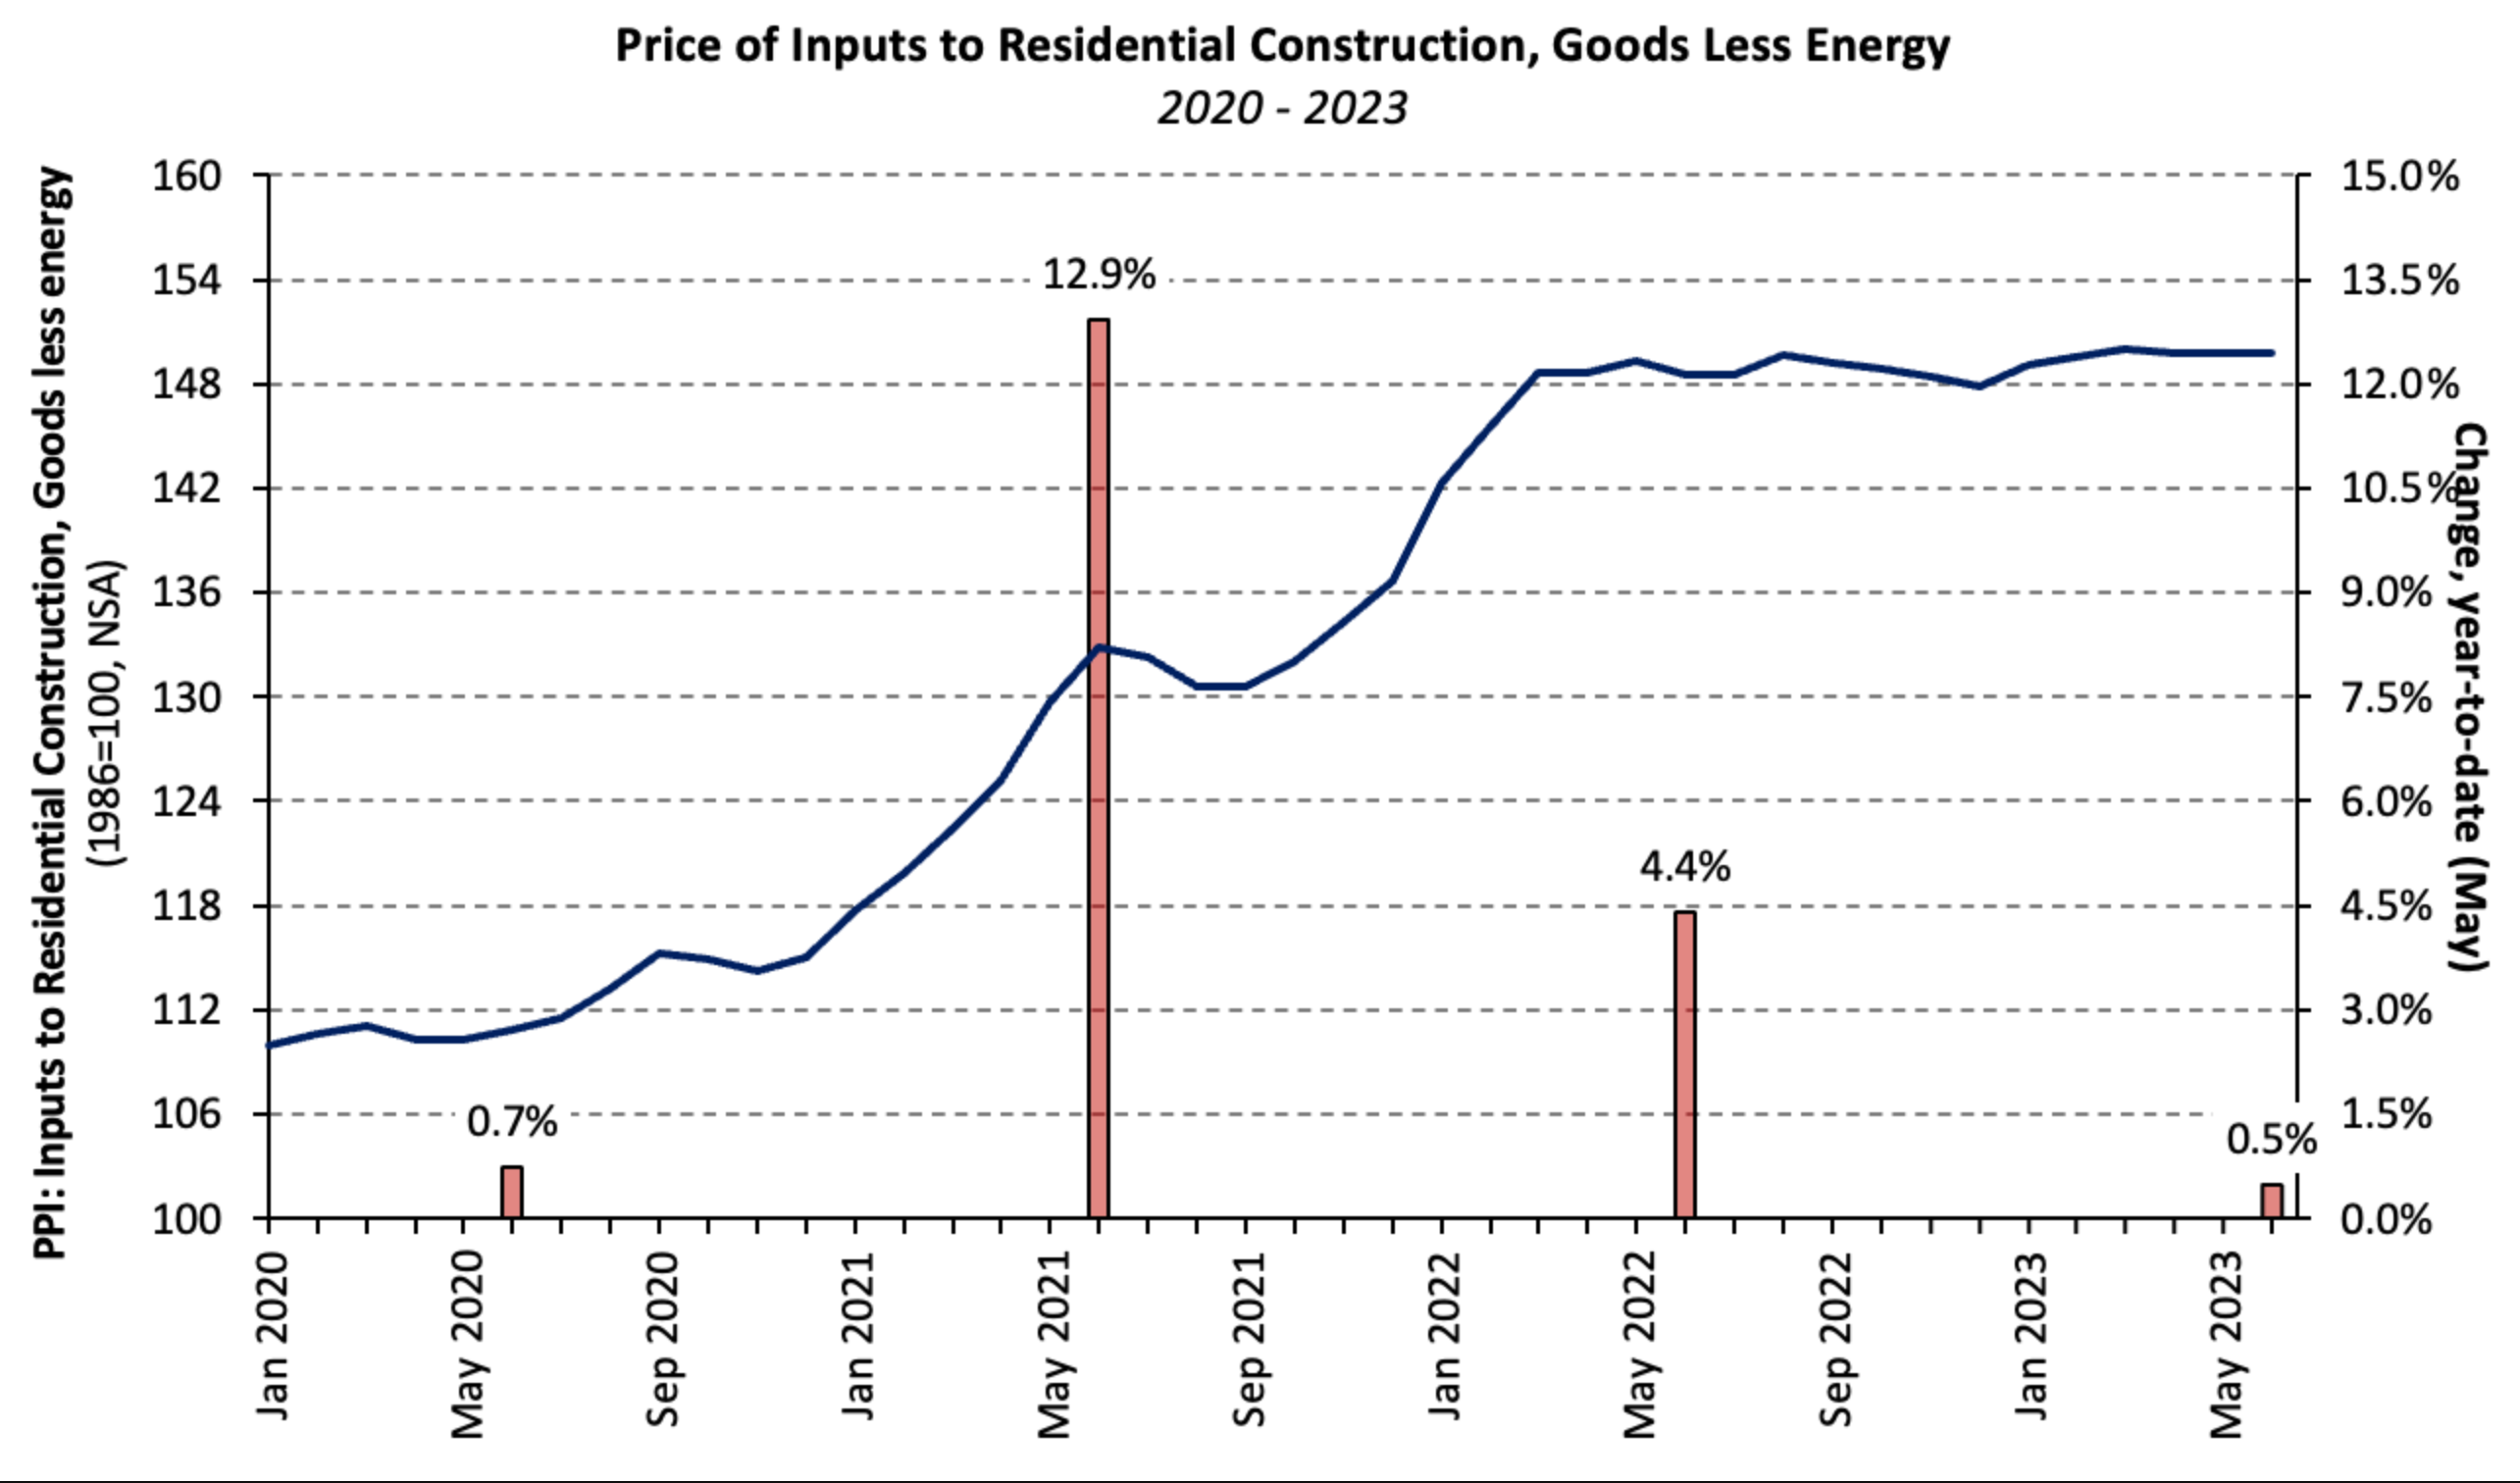
According to the latest Producer Price Index report, the price level of inputs to residential construction less energy (i.e., building materials) was unchanged in June 2023 (not seasonally adjusted). March 2023 was the last month prices increased. The index has gained 0.5%, year-to-date, and has not increased 1% or greater in any month since March 2022.
The Producer Price Index for all final demand goods was unchanged in June following a 1.6% decline in May (seasonally adjusted). Year-over-year, the index declined 0.2% while the PPI for final demand goods less food and energy increased 2.0% (not seasonally adjusted). The growth rates of the indices for final demand goods and final demand goods less food and energy have slowed 12 and 15 consecutive months, respectively, neither of which has occurred since the inception of the series.
The PPI for goods inputs to residential construction, including energy, has decreased 3.6% over the past 12 months—the largest 12-month decline since October 2009. June was the second consecutive month in which prices were unchanged.
Gypsum Building Materials
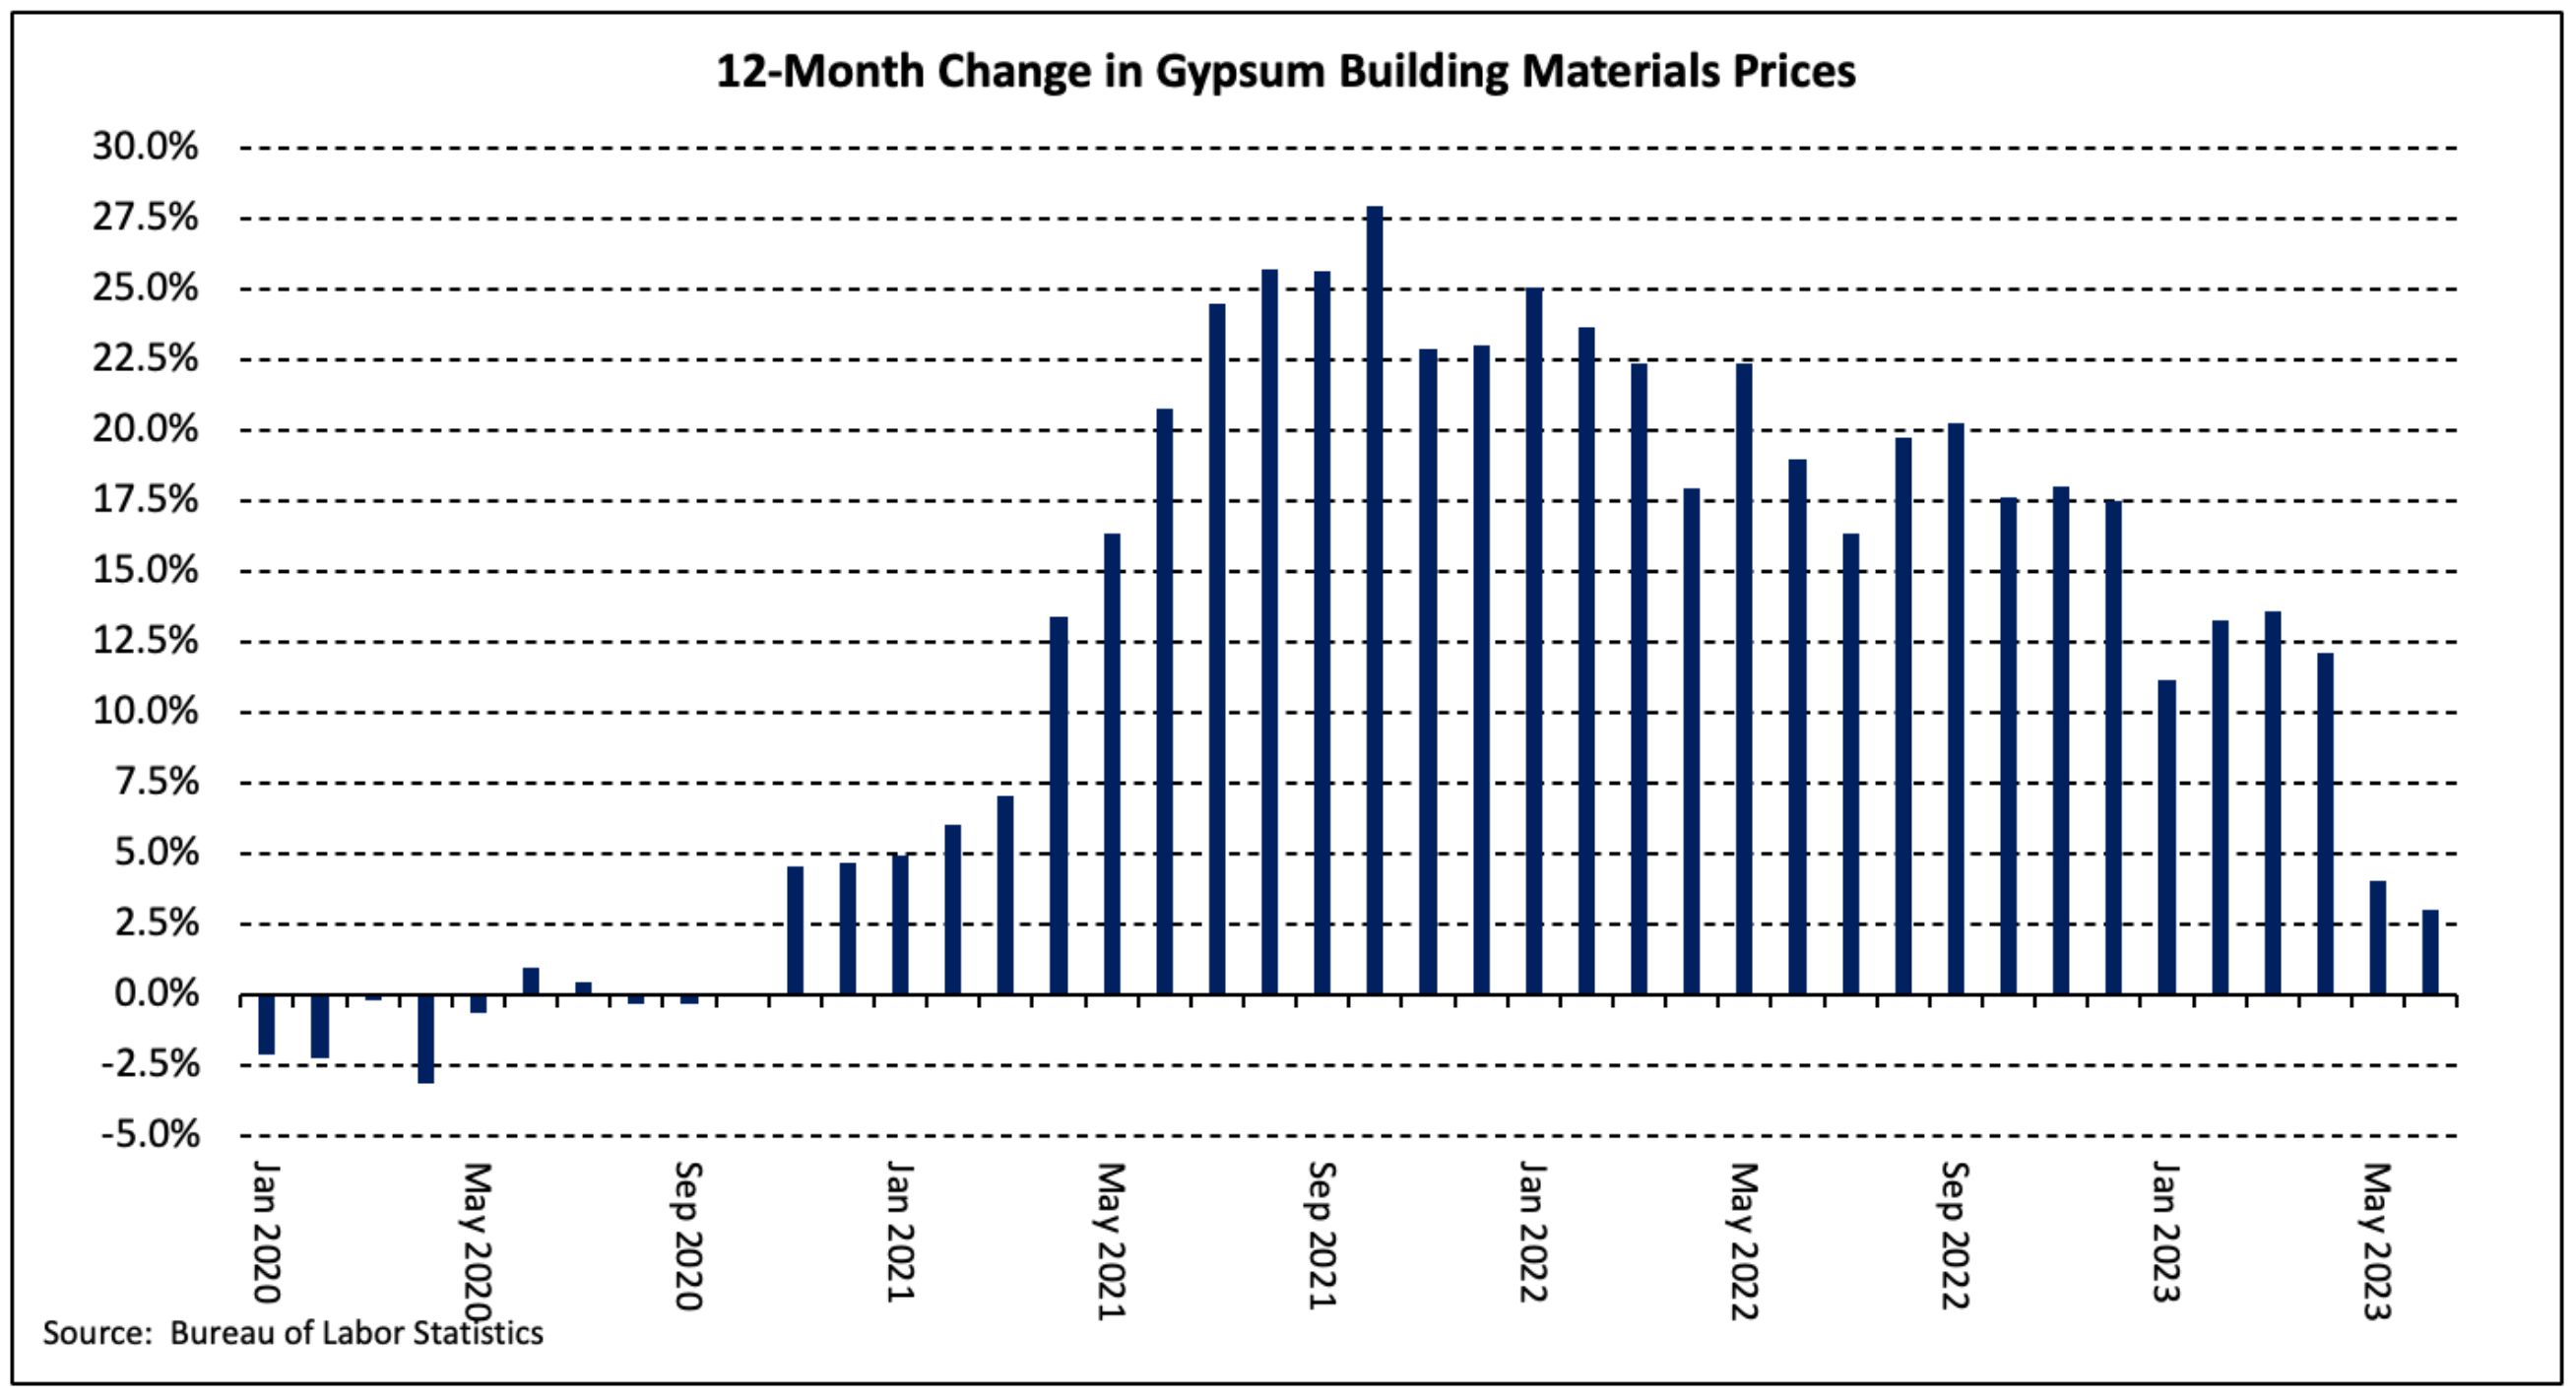
The PPI for gypsum building materials fell 0.3% in June after declining 1.1% in both April and May. Other than lumber, no building material posted 12-month price increases as large as those of gypsum building products in 2021 and 2022. Over the past nine months, however, those increases have slowed from 20.3% to 3.0%.
Steel Mill Products
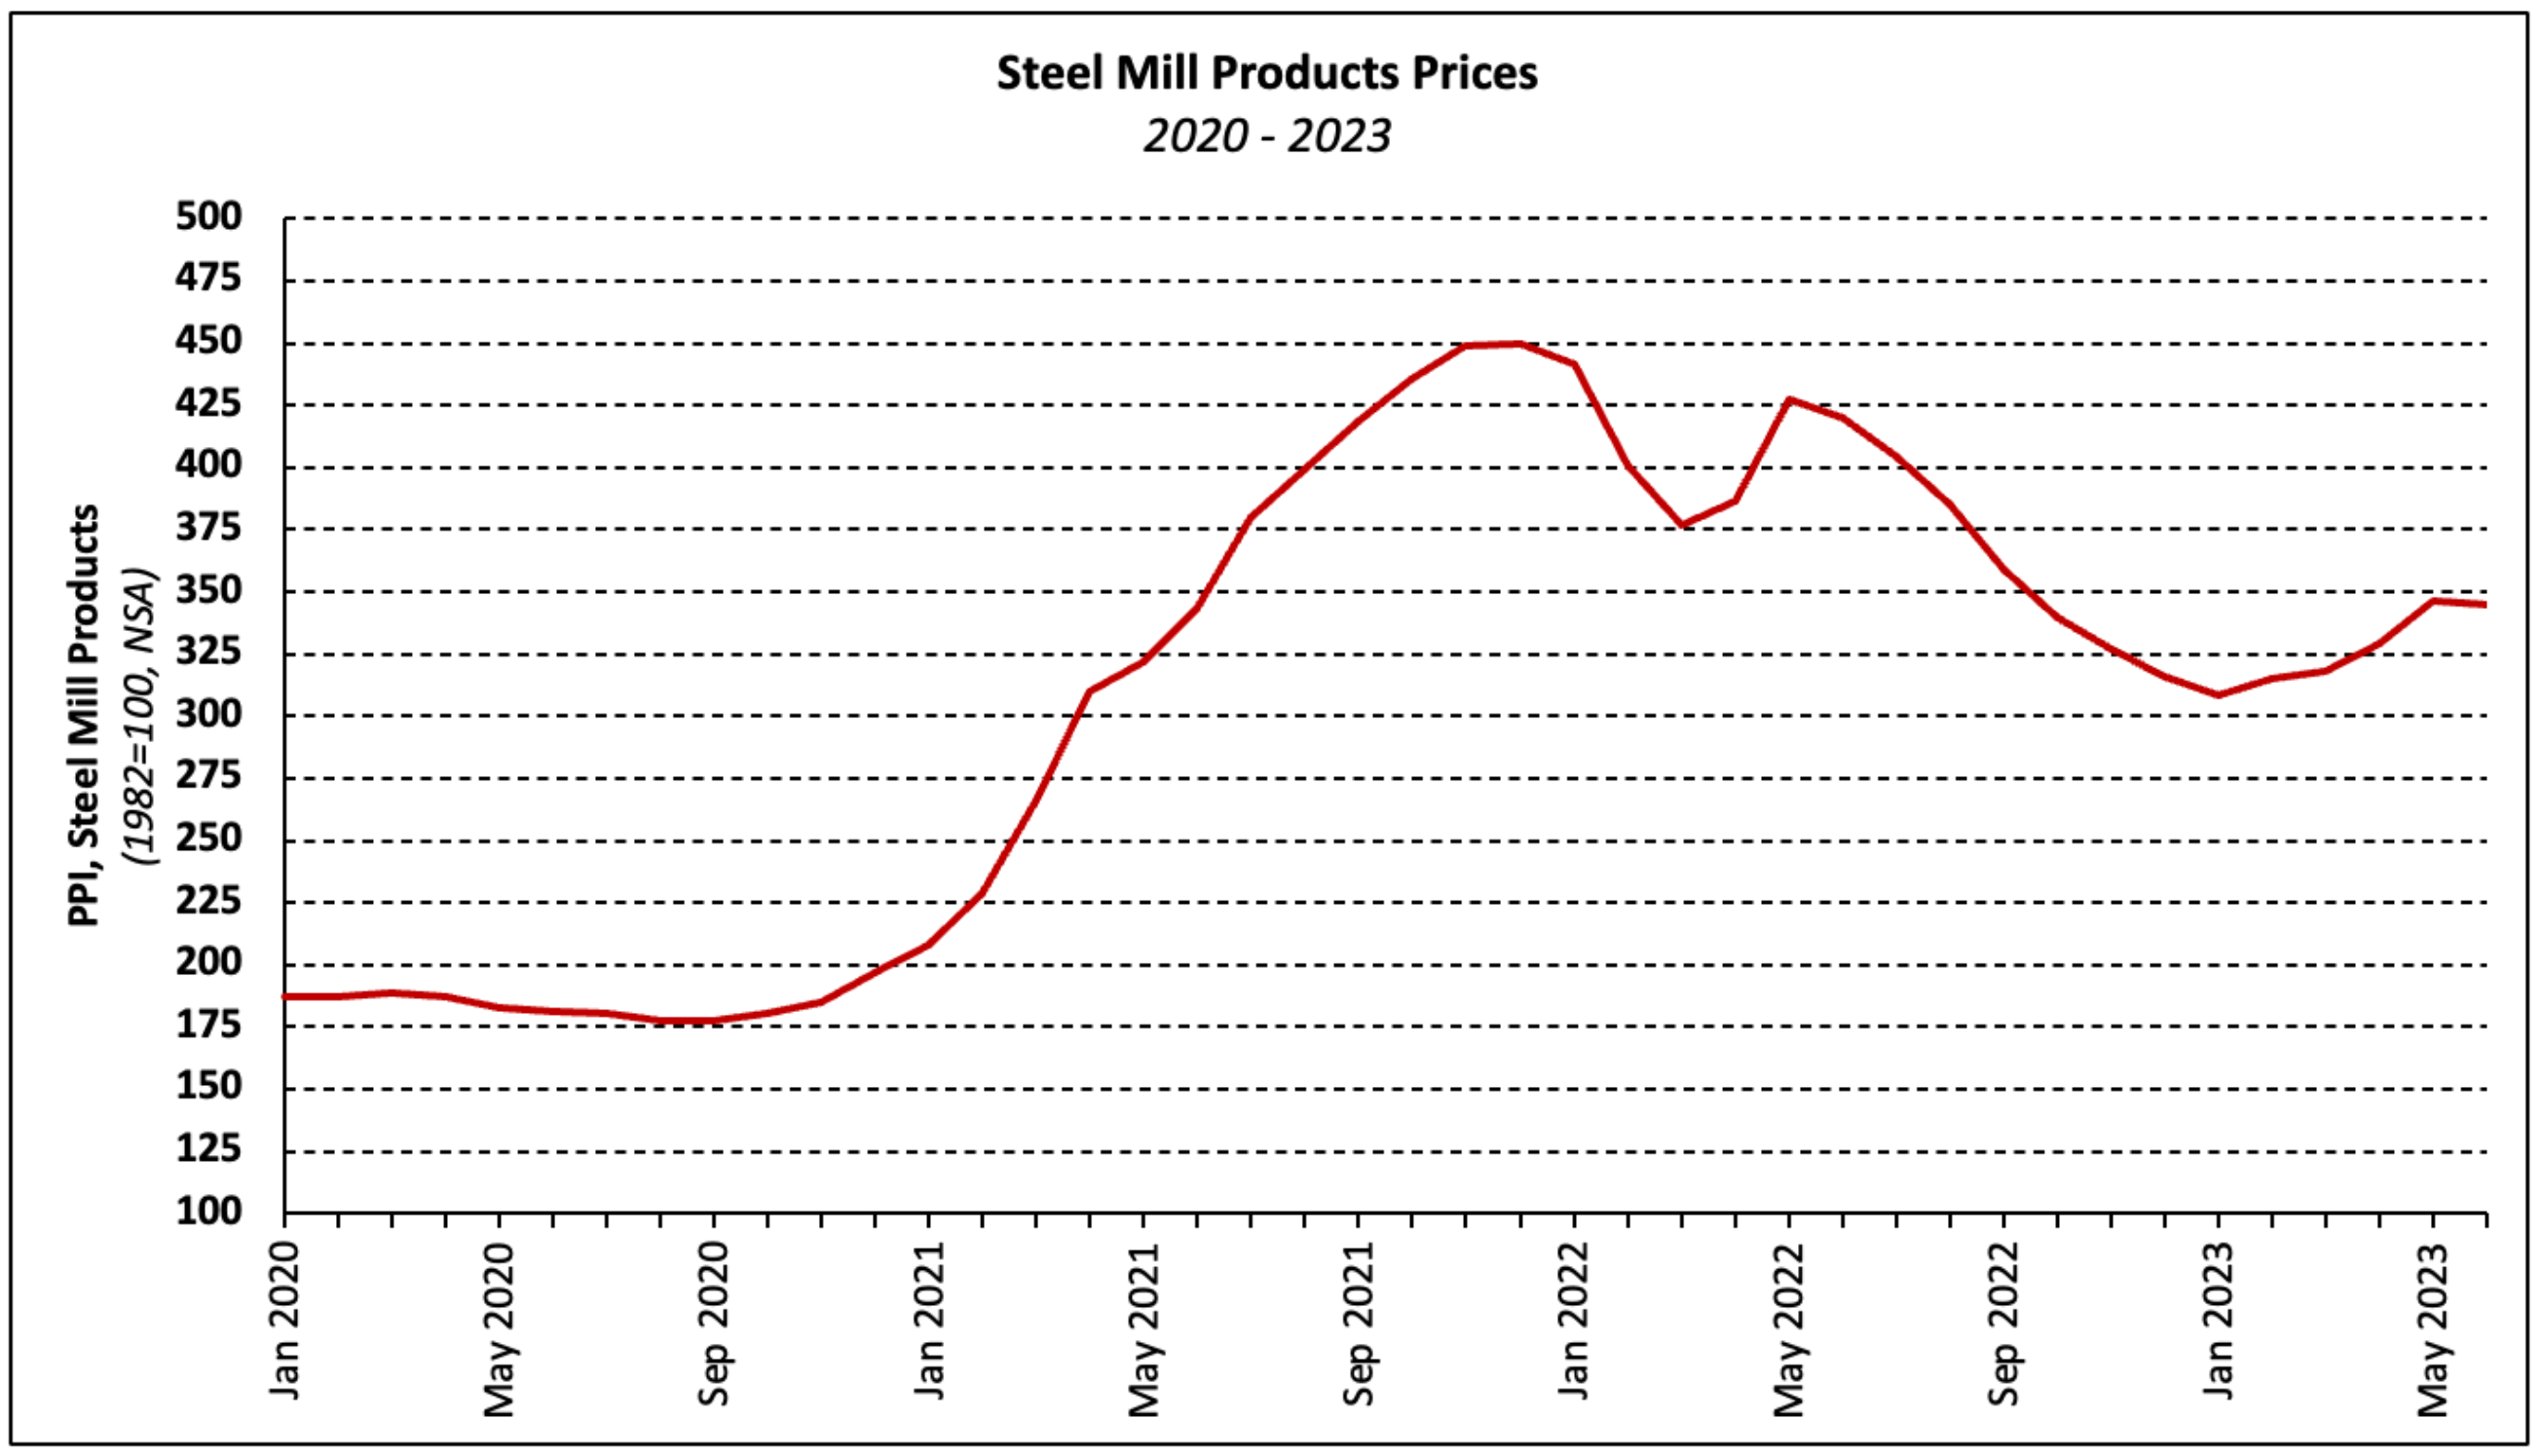
Steel mill products prices got a reprieve in June, declining 0.6% after a four-month period during which prices climbed 12.4%. Even after that period of rising prices, however, the index is 18.0% lower than it stood in June 2022.
Softwood Lumber
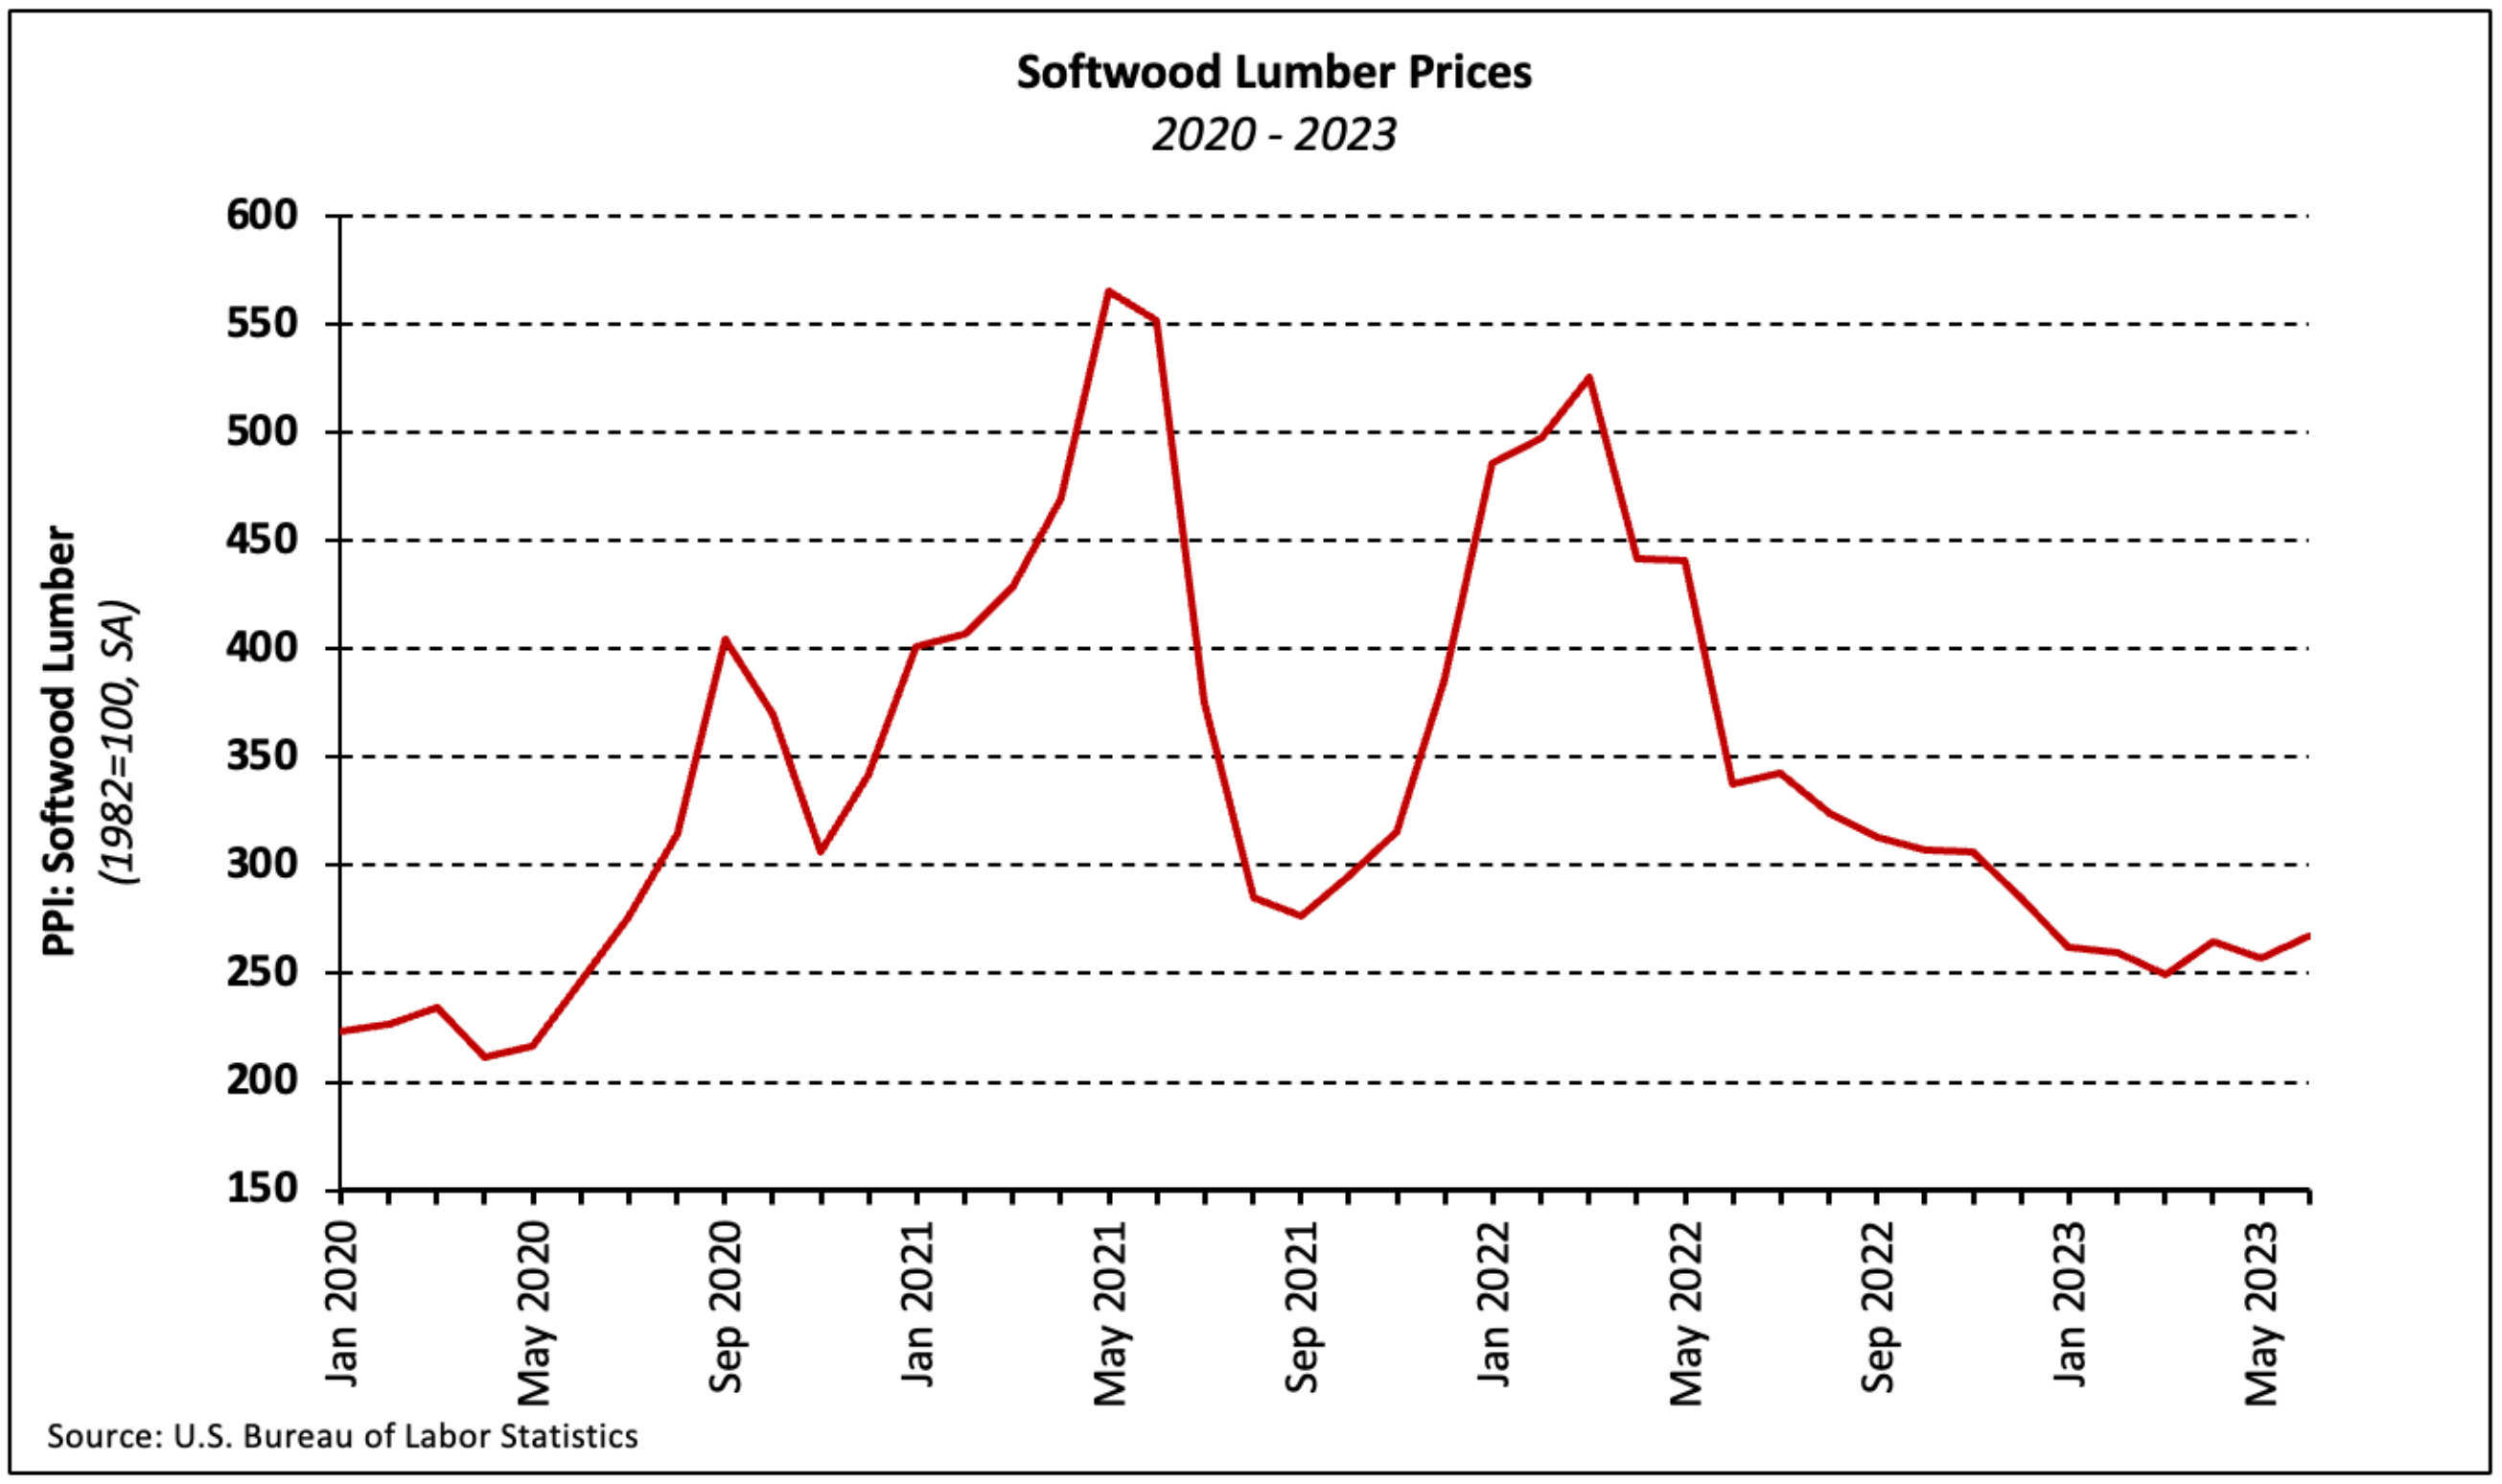
The PPI for softwood lumber (seasonally adjusted) increased 3.9% in June—the second increase over the past three months. Although prices are up 7.2% over that period, the index has decreased 20.9% over the past year and has fallen by more than half since its June 2021 peak.
Ready-Mix Concrete
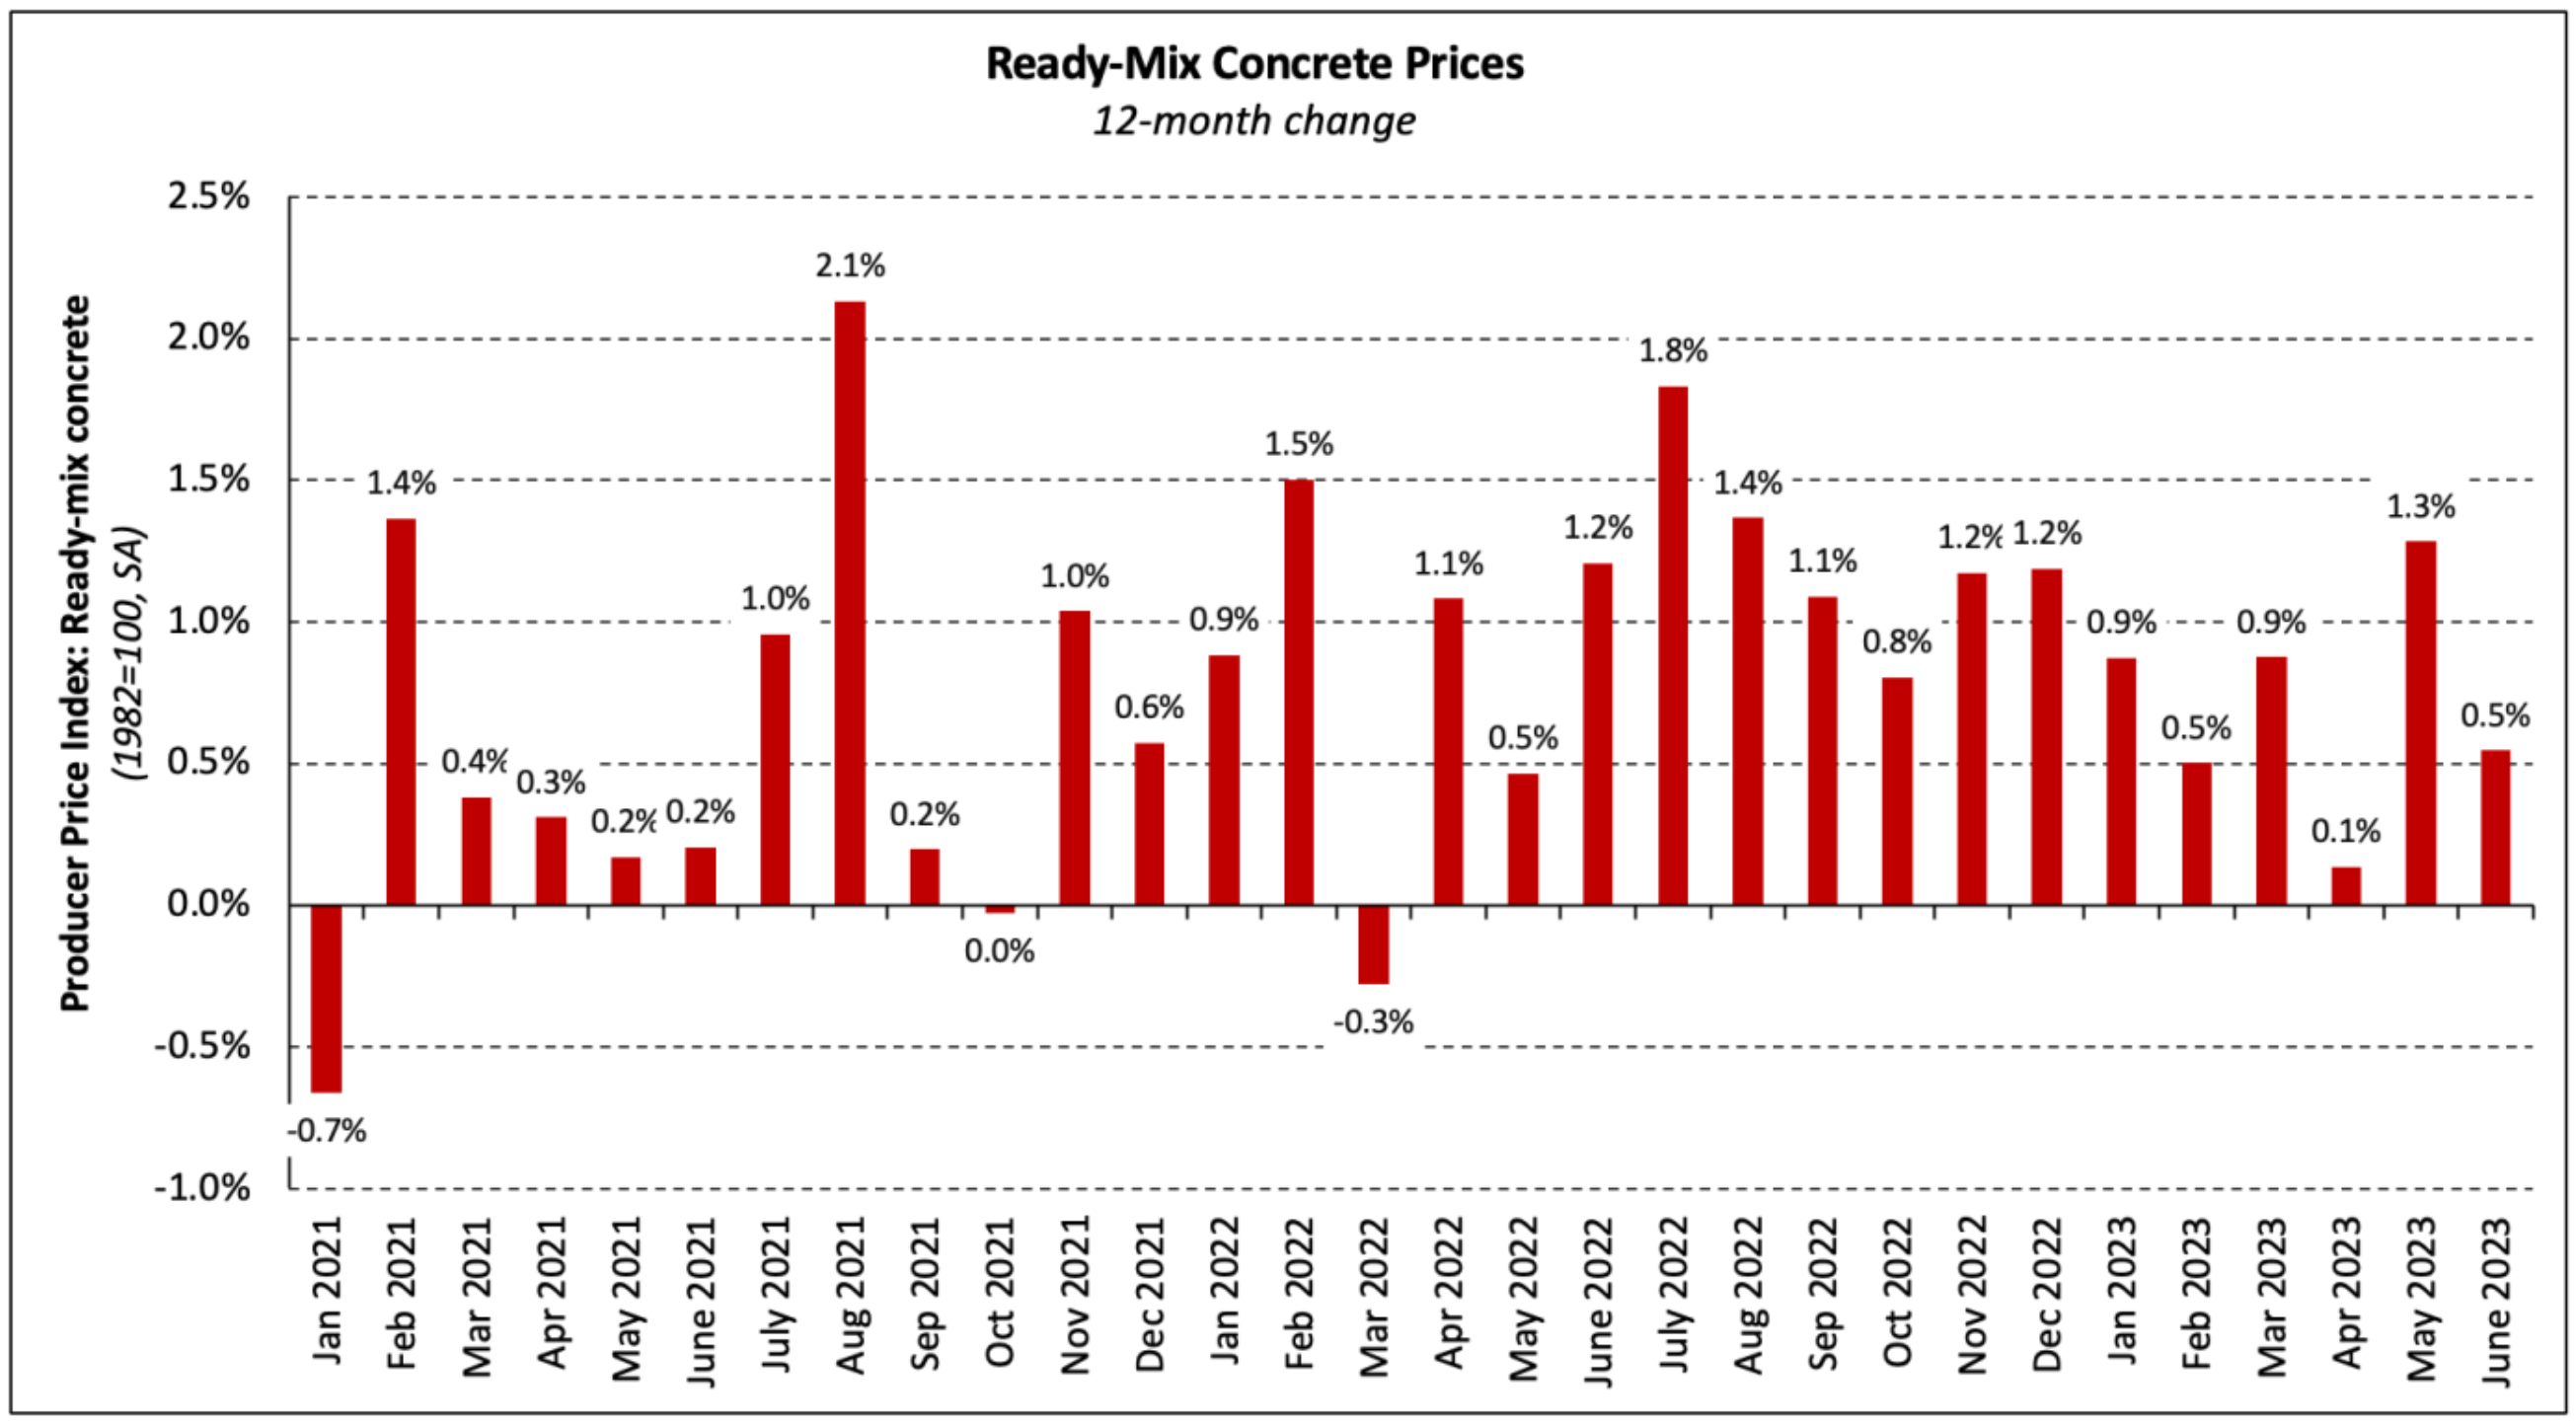
Ready-mix concrete (RMC) prices increased 0.5% in June. The PPI for RMC has risen each of the last 15 months, 27 of the last 30, and has climbed 12.3% over the past year. On a positive note, however, price growth slowed 0.8 percentage point over the month and the average monthly increase has declined from 1.0% in 2022 to 0.7% in 2023.
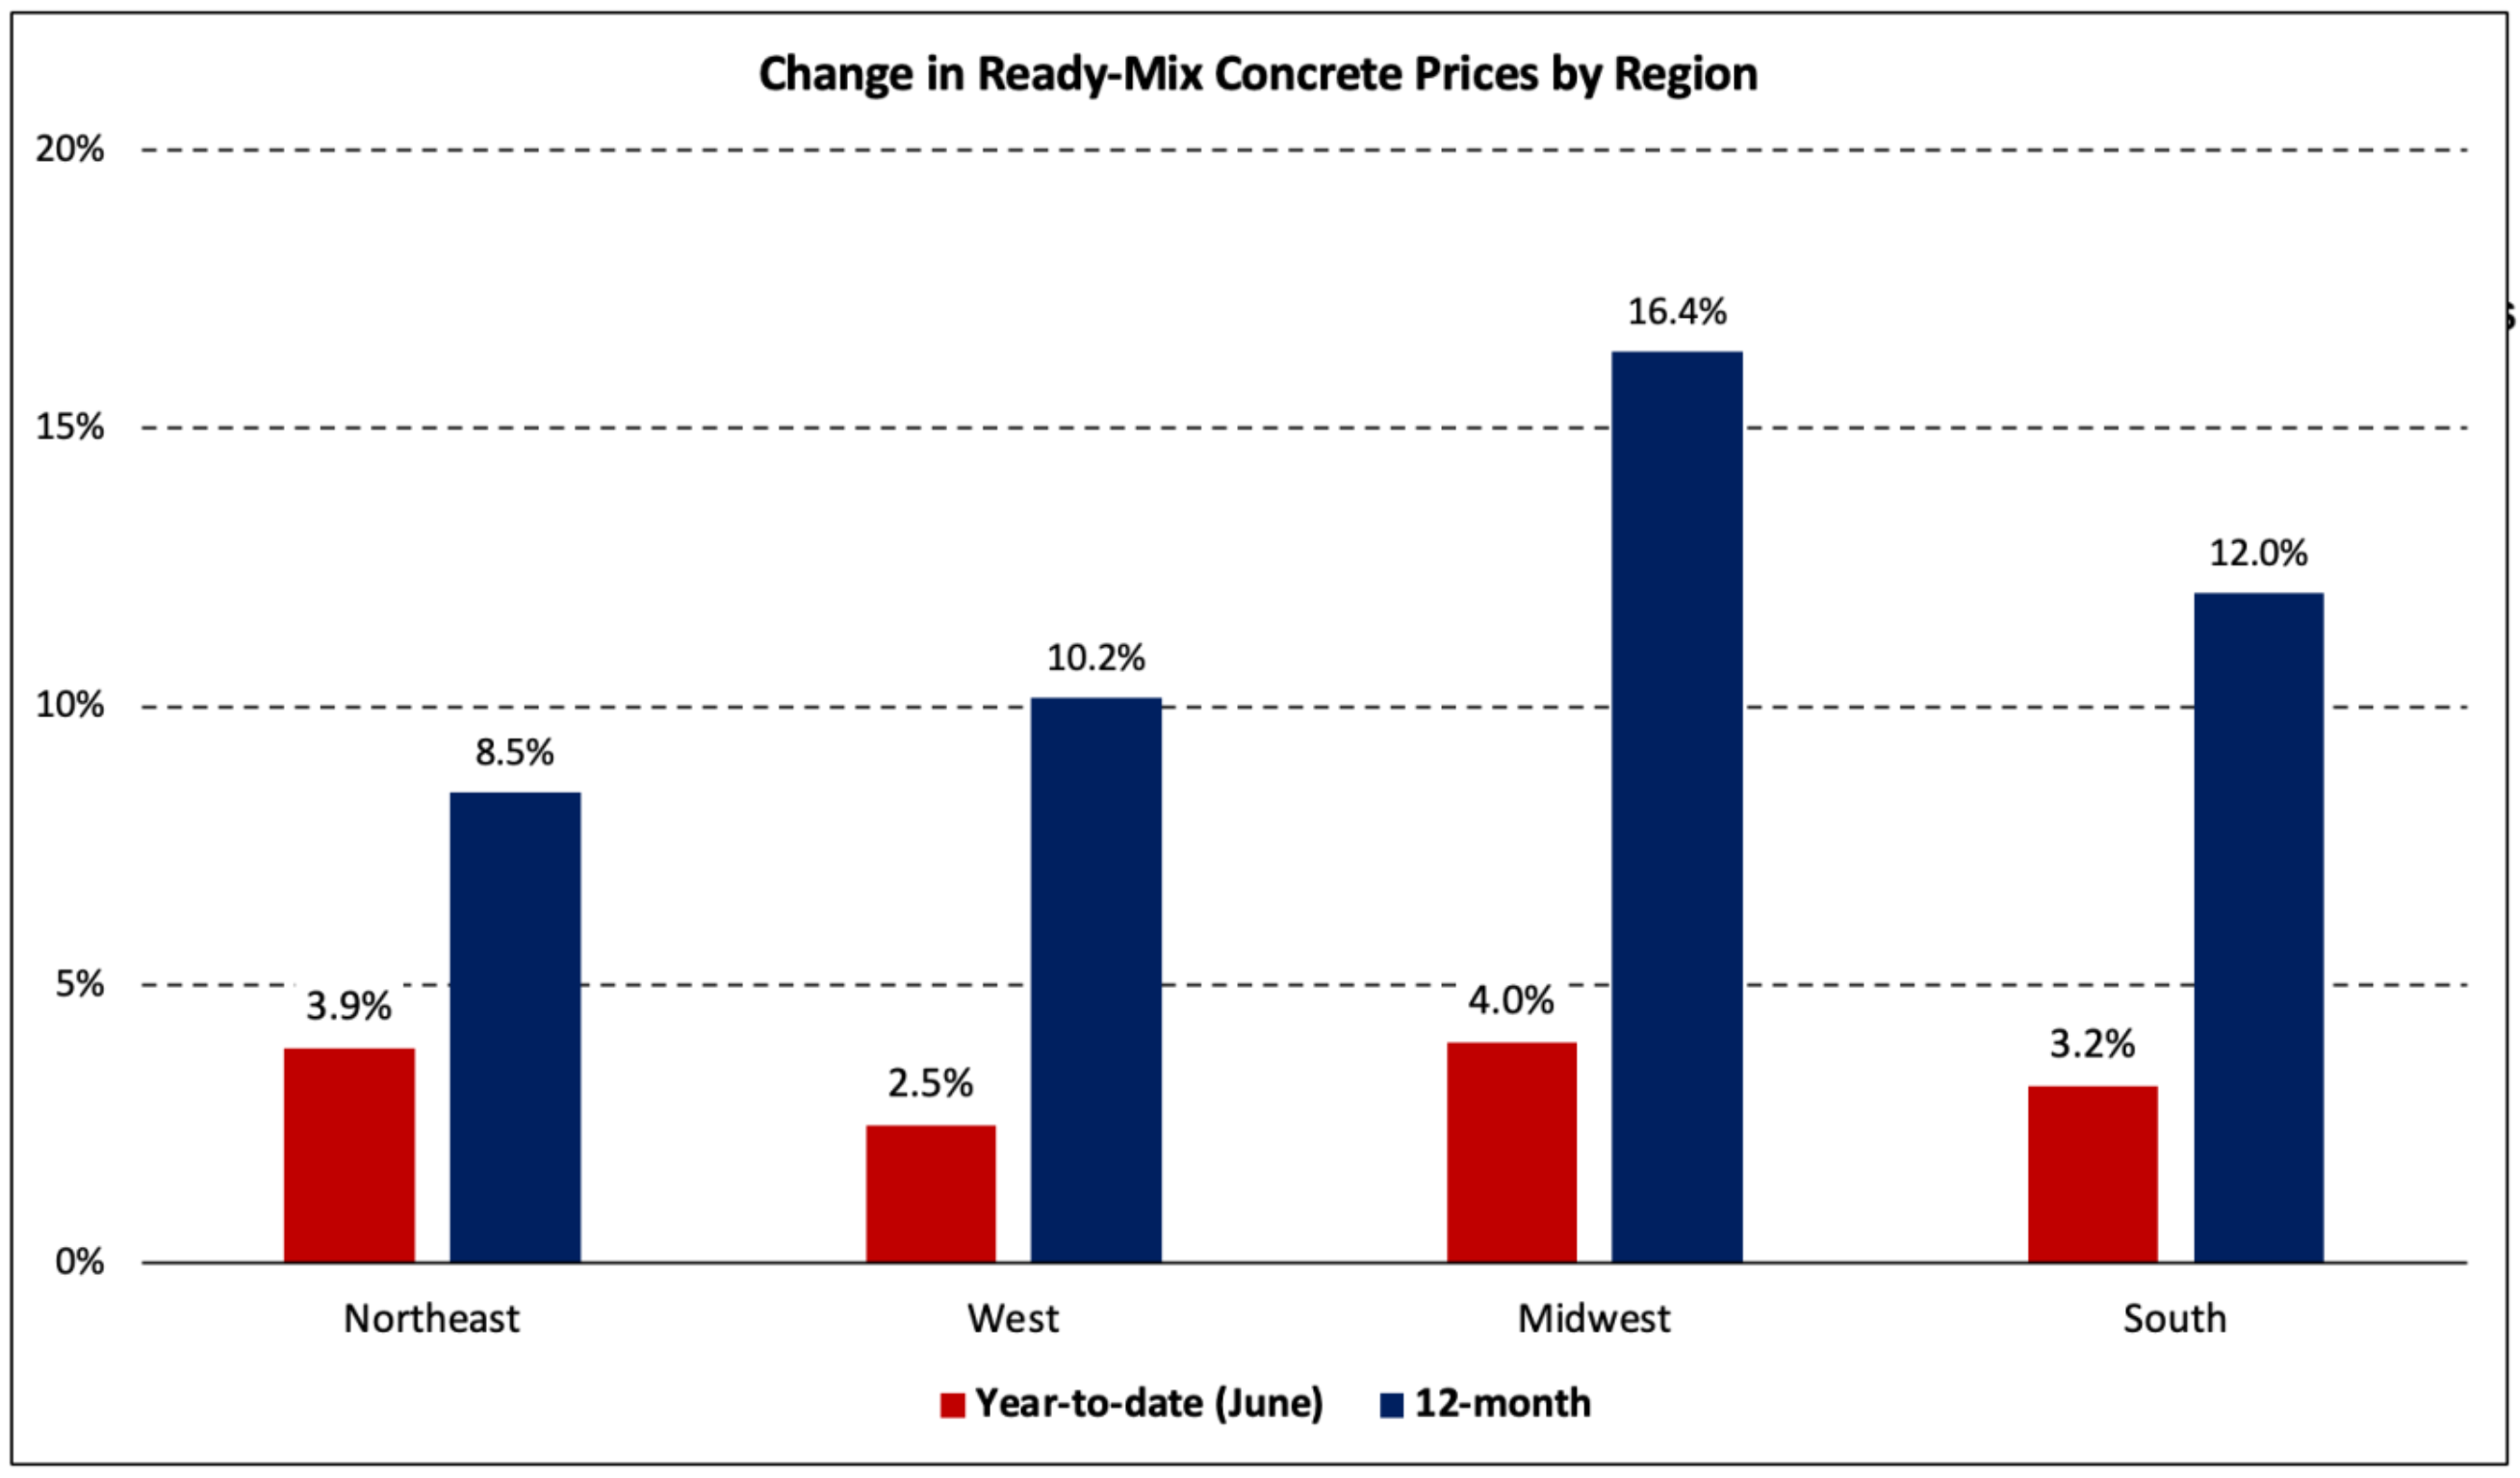
Prices were unchanged in the Northeast and Midwest (not seasonally adjusted), but increased 0.2% and 0.5% in the South and West, respectively. Year-to-date, prices have increased the most in the Midwest, followed by the Northeast, South, and West regions.
Services
The price index of services inputs (excluding labor) to residential construction increased 0.2% in June after a 1.0% decline in May. Prices have declined 8.8% over the past year but have stabilized in 2023, down 0.1% through June.
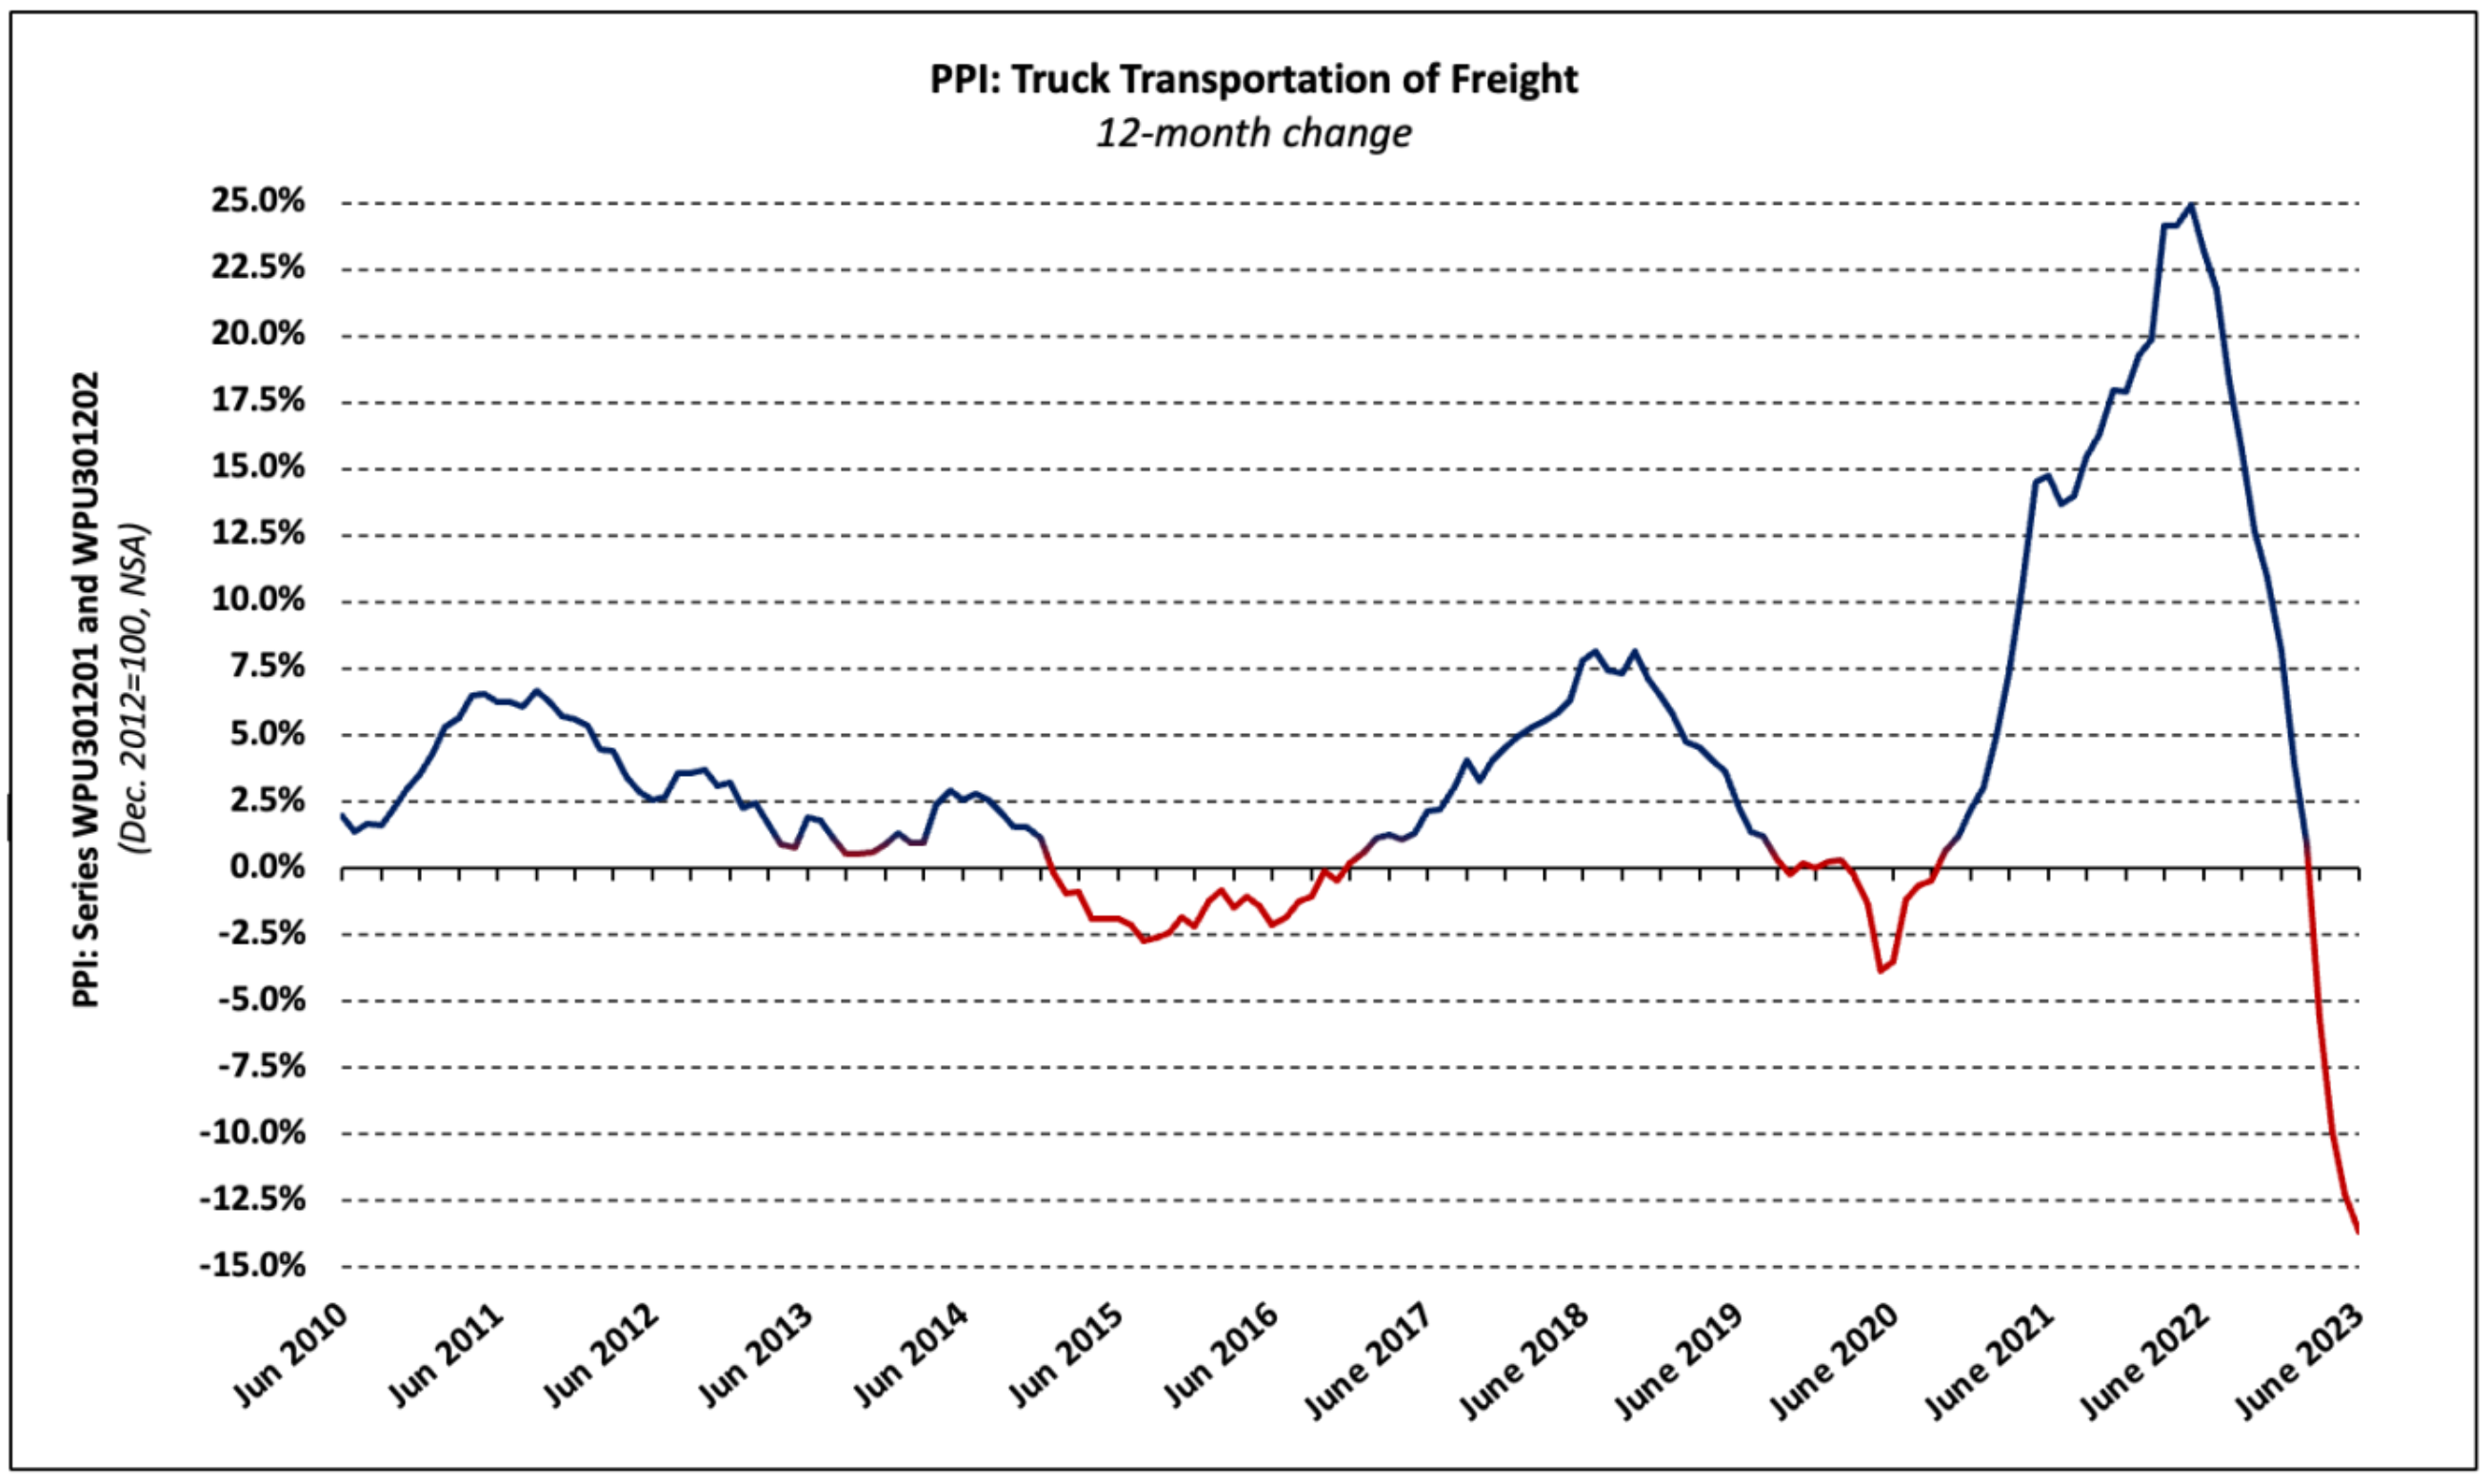
Freight Prices
The price of truck and rail transportation of freight decreased 2.1% and 0.4%, respectively, in June while the PPI for deep sea (i.e., ocean) freight increased 0.4%. Trucking freight prices have declined 13.7% over the past year with both long-distance (-15.1%) and local (-9.2%) motor carrying prices falling 9.2% and 4.1%, respectively. The 12-month drop in trucking prices is the largest decline since the inception of the data series in 2009.
