Charts: Housing Permits Down in August 2022
Originally Published by: NAHB — September 20, 2022
SBCA appreciates your input; please email us if you have any comments or corrections to this article.
Editor's Note: Housing starts and building permits are leading monthly indicators of residential building activity. Building permits are issued by building departments, signaling a green light to begin construction, and they indicate future construction. Housing starts reflect the number of homes, apartment buildings or townhouses on which construction began in a given month.
In August, housing starts rebounded but housing permits declined for the second straight month. The August drop in building permits indicates that the housing market is continues to cool as rising construction costs, elevated mortgage rates and supply chain disruptions continue to act as a drag on the market.
Overall housing starts rose 12.2% to a seasonally adjusted annual rate of 1.58 million units in August, according to a report from the U.S. Department of Housing and Urban Development and the U.S. Census Bureau. The August reading of 1.58 million starts is the number of housing units builders would begin if development kept this pace for the next 12 months.
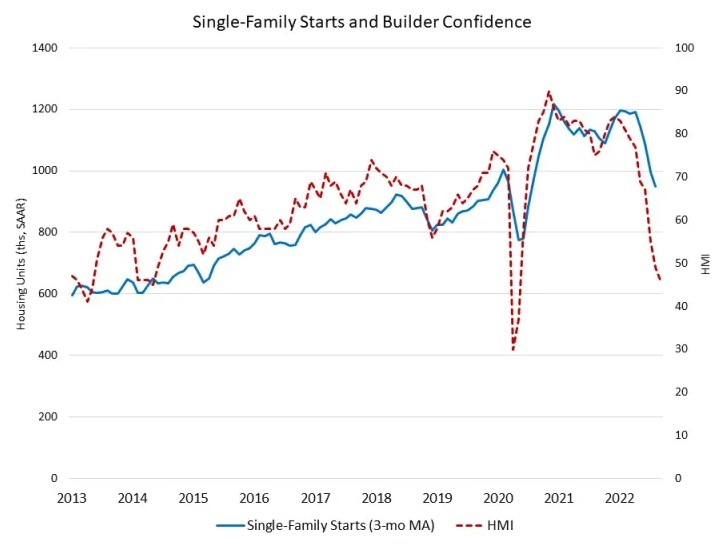
Single-family starts increased 3.4% to a 935,000 seasonally adjusted annual rate and are down 4% on a year-to-date basis. Declines are expected ahead, as single-family permits decreased 3.5% to an 899,000 annualized rate and are down 6.6% on a year-to-date basis. NAHB is forecasting 2022 to be the first year since 2011 to record an annual decline in single-family home building.
A housing recession is underway with builder sentiment falling for ninth consecutive months. In September, single-family builder confidence decreased three points to a level of 46, the lowest level since May 2014 with the exception of the spring of 2020, according to the NAHB/Wells Fargo Housing Market Index (HMI). Builders are reporting weakening traffic as housing affordability declines.

The multifamily sector, which includes apartment buildings and condos, increased 28% to an annualized 640,000 pace. Multifamily construction remains very strong given solid demand for rental housing. The number of multifamily 5+ units currently under construction is up 26.5% year-over-year. Multifamily development is being supported by a substitution effect, with frustrated or priced out prospective home buyers seeking rental housing. However, multifamily permits decreased 17.9% to an annualized 618,000 pace.
The number of single-family homes permitted but not started construction peaked in July due to supply-chain issues. In August, there were 143,000 homes authorized but not started construction. The number of multifamily 5+ units permitted but not started construction is up 31.2% year-over-year to 143,000 units.
On a regional and year-to-date basis, combined single-family and multifamily starts are 4.6% higher in the Northeast, 2.4% lower in the Midwest, 5.6% higher in the South and 1.5% lower in the West. Looking at regional permit data on a year-to-date basis, permits are 3.1% lower in the Northeast, 1.2% higher in the Midwest, 1.2% higher in the South and 1.4% lower in the West.

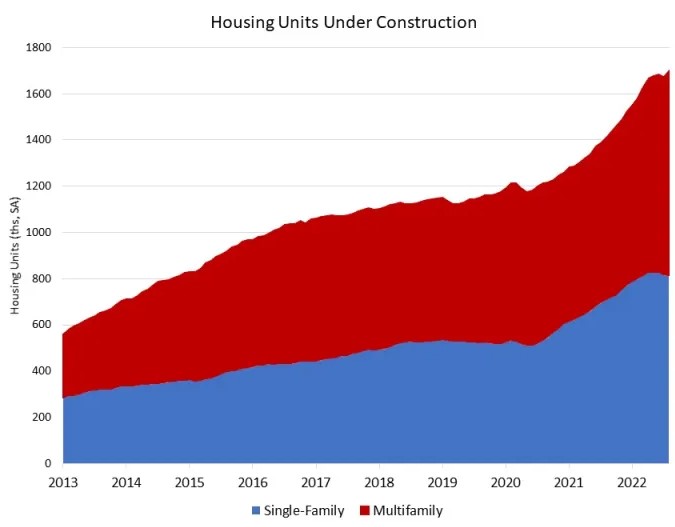
As an indicator of the economic impact of housing and as a result of accelerating permits and starts in recent quarters, there are now 812,000 single-family homes under construction. This is 14% higher than a year ago. There are currently 890,000 apartments under construction (2+ unit properties), up 27% from a year ago with this number continuing to rise. This is the highest level since the first quarter of 1974.
Total housing units now under construction (single-family and multifamily combined) is 21% higher than a year ago. The number of single-family units in the construction pipeline is now falling and will continue to decline in the months ahead given recent declines in buyer traffic.
